Building a Dashboard
Objective: Build and share a dashboard that visualizes data from your saved tables.
Creating a New Dashboard
Section titled “Creating a New Dashboard”- Click Dashboards → Create Dashboard (top-right).
- Name it and Create. You start in edit mode.
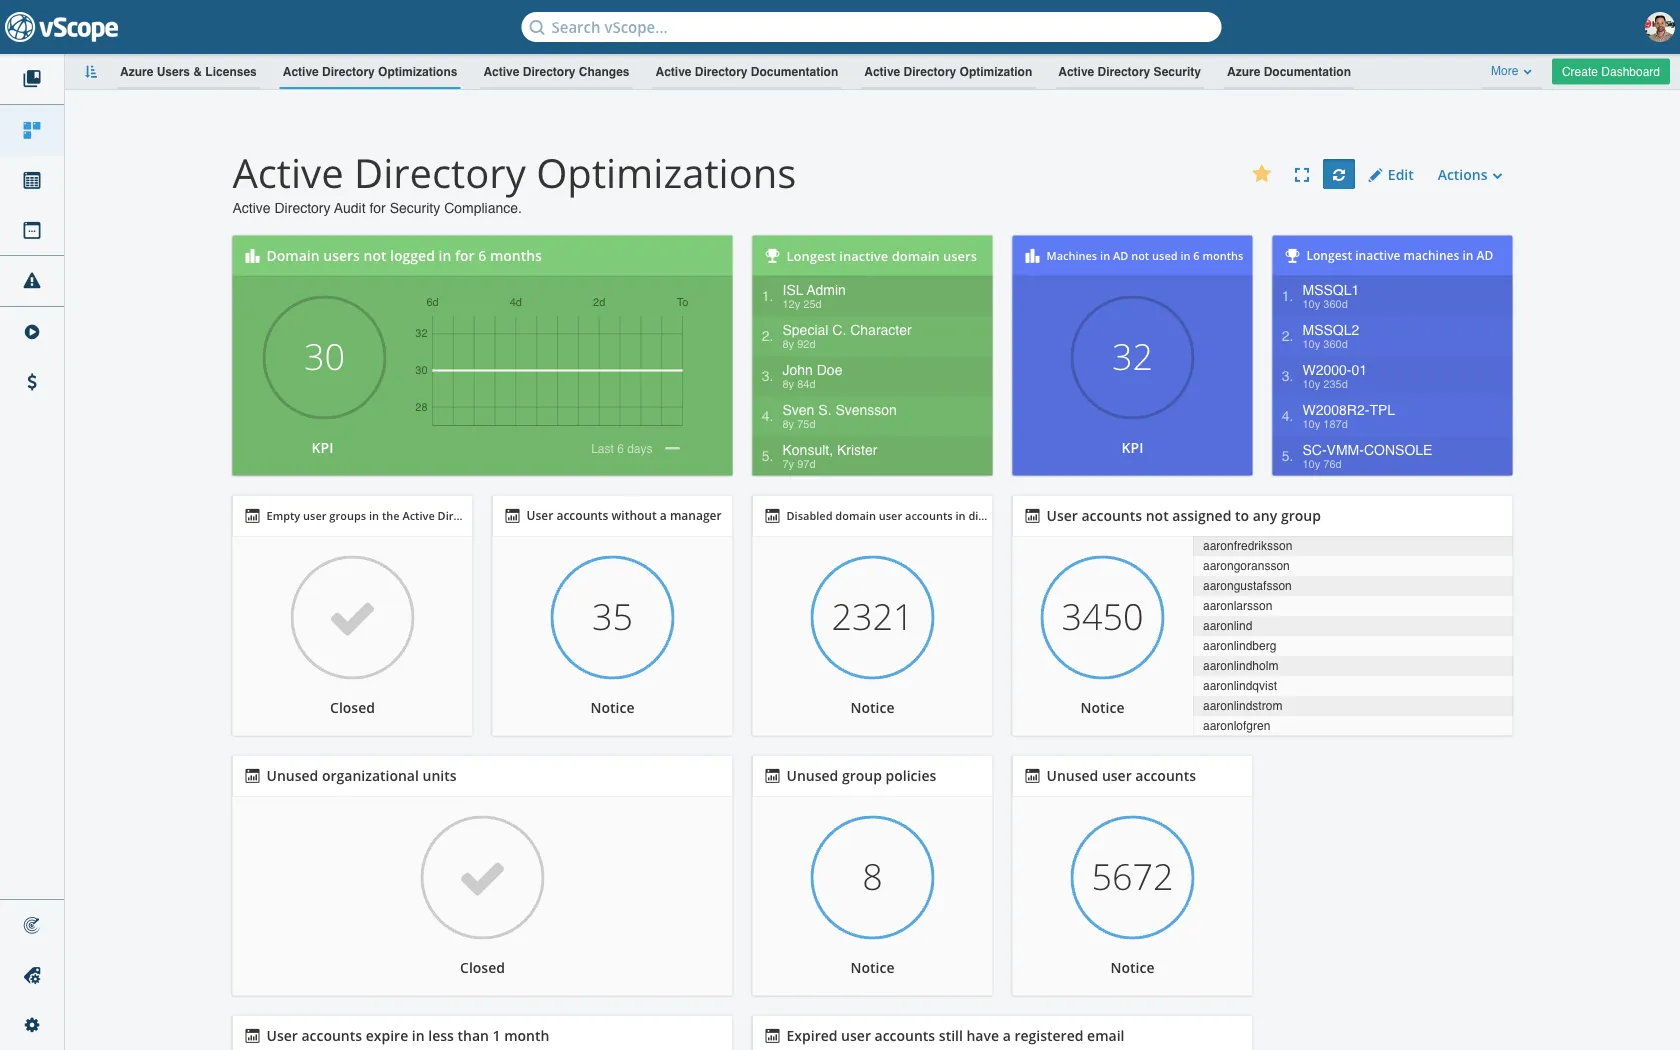
Adding Widgets
Section titled “Adding Widgets”- Click + Add widget.
- Choose a saved table as the data source. (All widgets require a saved table.)
- Pick widget type: KPI, Top list, Ratio, Comparison, or Tracker case widget.
- Adjust size (compact/extended) and add to the grid.
Share and permissions
Section titled “Share and permissions”- Click Collaborators to share with users/groups.
- View permissions on the dashboard respect the permissions of its source tables. Ensure collaborators can access those tables.
Verify and adjust
Section titled “Verify and adjust”- Switch to View mode to confirm widgets load correctly.
- Drag to reorder; resize as needed.
- Star the dashboard to show it on Home.
Next steps
Section titled “Next steps”- Schedule table emails (via Tables) to push KPI details.
- Add Tracker widgets for compliance/change cases.