Power BI
In this guide, you’ll learn how to integrate Power BI with vScope using the API to set up vScope as a data stream to Power BI, enabling automated data extraction and visualization.
You can find the setup guide and documentation here.
If you’d rather build your own reports and customize the data, just continue with the setup below.
Prerequisites
Section titled “Prerequisites”Before starting, ensure you have an API Token for secure access to vScope. Follow this guide for token setup: Fetching data via API.
Also, make sure you have access to Power BI through the web or that it is installed on your computer. Download Power BI
Create a Source Table in vScope
Section titled “Create a Source Table in vScope”Before connecting vScope to Power BI, we first need to make the relevant asset data available through the vScope API. This is done by creating a source table in vScope that defines which resources, columns, and filters should be included. The table will serve as the foundation for the data stream into Power BI, and you can easily update it later to expose additional data through the API.
- Open Table Explorer and create a new table by selecting All Machines as the resource.
- Add Columns: Add columns such as IP and CPU Usage to customize your data.
- Add Filters: For example, filter machines with Running = true.
- Save Table: Give your table a clear, descriptive name. (e.g., All Machines - Source Table for Power BI).
- Locate TableID: After saving, go to Collaborators and find the Permalink ID for the table (the unique identifier at the end of the link).
Get the Data into Power BI
Section titled “Get the Data into Power BI”Power BI allows data imports from various sources, including API endpoints. You’ll use the vScope endpoint for XLSX export to pull the table directly into Power BI.
- Find Endpoint: Use this format to create the endpoint URL:
GET https://{YOUR-VSCOPE-URL}/rest/tables/{YOUR-TABLEID}/xlsxReplace {YOUR-TABLEID} with the ID from vScope and {YOUR-VSCOPE-URL} with your server address.
- Power BI Setup:
- Open Power BI.
- Go to Home and select New report
- Select the data source Get Data
- In the search bar type and select Blank query
- Leave the query as it is and click Next
- Configure API Request in Power Query:
-
Under the Home tab, select Manage parameters (click on the icon).
-
A pop-up window will appear. Below the title, you’ll see a small button New. Click it.
-
Add the following parameter:
- Name:
vScopeToken - Description:
vScope API token - Required: No
- Type:
Text - Suggested values:
Any value - Current value:
{YOUR-API-TOKEN}
- Name:
-
Repeat this process for
vScopeTableId,vScopeServerURL.
- Configure and Load Query:
- When you’re done, open the Advanced editor under the Home tab.
- Copy this query and paste it into the editor:
let  // ---- Settings/params you already have ----  BaseUrl = vScopeServerURL,               // e.g. "https://your-vscope-server"  TableId = vScopeTableId,                 // the table guid/id  Token   = vScopeToken,                   // vScope token
  // ---- Simple exponential-backoff wrapper (handles transient 429/5xx) ----  RetryWithBackoff = (thunk as function, optional maxRetries as number, optional baseDelaySec as number) as any =>  let    Max = if (maxRetries <> null) then maxRetries else 4,    Base = if (baseDelaySec <> null) then baseDelaySec else 2,    Fn = (attempt as number) =>      let        result = try thunk(),        out =          if result[HasError] then            if attempt < Max then              Function.InvokeAfter(() => Fn(attempt + 1), #duration(0,0, Base * Number.Power(2, attempt), 0))            else              error result[Error]          else            result[Value]      in        out  in    Fn(0),
  // ---- API call using RelativePath + Query (better credential scoping) ----  GetBinary = () as binary =>    let      resp =        Web.Contents(          BaseUrl,          [            RelativePath = "rest/tables/" & TableId & "/xlsx",            Query = [              exportRawNumeric      = "false",              truncateCells         = "false",              includeFullSheetName  = "false"            ],            Headers = [              #"Accept"        = "application/vnd.openxmlformats-officedocument.spreadsheetml.sheet",              #"User-Agent"    = "PowerQuery",              token            = Token            ],            Timeout = #duration(0, 0, 120, 0),            ManualStatusHandling = {429, 500, 502, 503, 504}          ]        ),      status = try Value.Metadata(resp)[Response.Status] otherwise 200,      // Treat transient statuses as errors to trigger retry:      ensure =        if status = 429 or status >= 500 then          error error "Transient HTTP status " & Text.From(status)        else          resp    in      ensure,
  // Buffer the binary once so Excel.Workbook doesn't re-read the stream  BinaryXlsx = Binary.Buffer( RetryWithBackoff( () => GetBinary(), 4, 2 ) ),
  // Parse workbook but don't assume sheet index; pick the sheet with most rows  Sheets = Table.SelectRows( Excel.Workbook(BinaryXlsx, false, true), each [Kind] = "Sheet"),  WithCounts = Table.AddColumn(Sheets, "Rows", each try Table.RowCount([Data]) otherwise 0, Int64.Type),  Sorted = Table.Sort(WithCounts, {{"Rows", Order.Descending}}),  FirstNonEmpty = if Table.RowCount(Sorted) > 0 then Sorted{0}[Data] else #table({},{}),
// Promote headers after we picked the right sheet PromotedHeaders = Table.PromoteHeaders(FirstNonEmpty, [PromoteAllScalars = true])in PromotedHeaders- Configure Connection:
-
After saving the query, you will be prompted to Configure connection
-
Click on Configure connection
-
Add the following as data source:
- Connection:
Create new connection - Connection name:
your-connection-name - Data gateway: none
- Authentication type:
Anonymous - Privacy level: none
- Connection:
-
And click Connect
- Schedule Refresh:
To schedule a refresh for a Power BI semantic model, go to the workspace, select the semantic model, and click Schedule refresh. Configure the refresh frequency, time zone, and specific refresh times as needed. Make sure to provide valid data source credentials, and note that an on-premises data gateway is required if your data sources are hosted locally. Read more here.
Visualize the Data
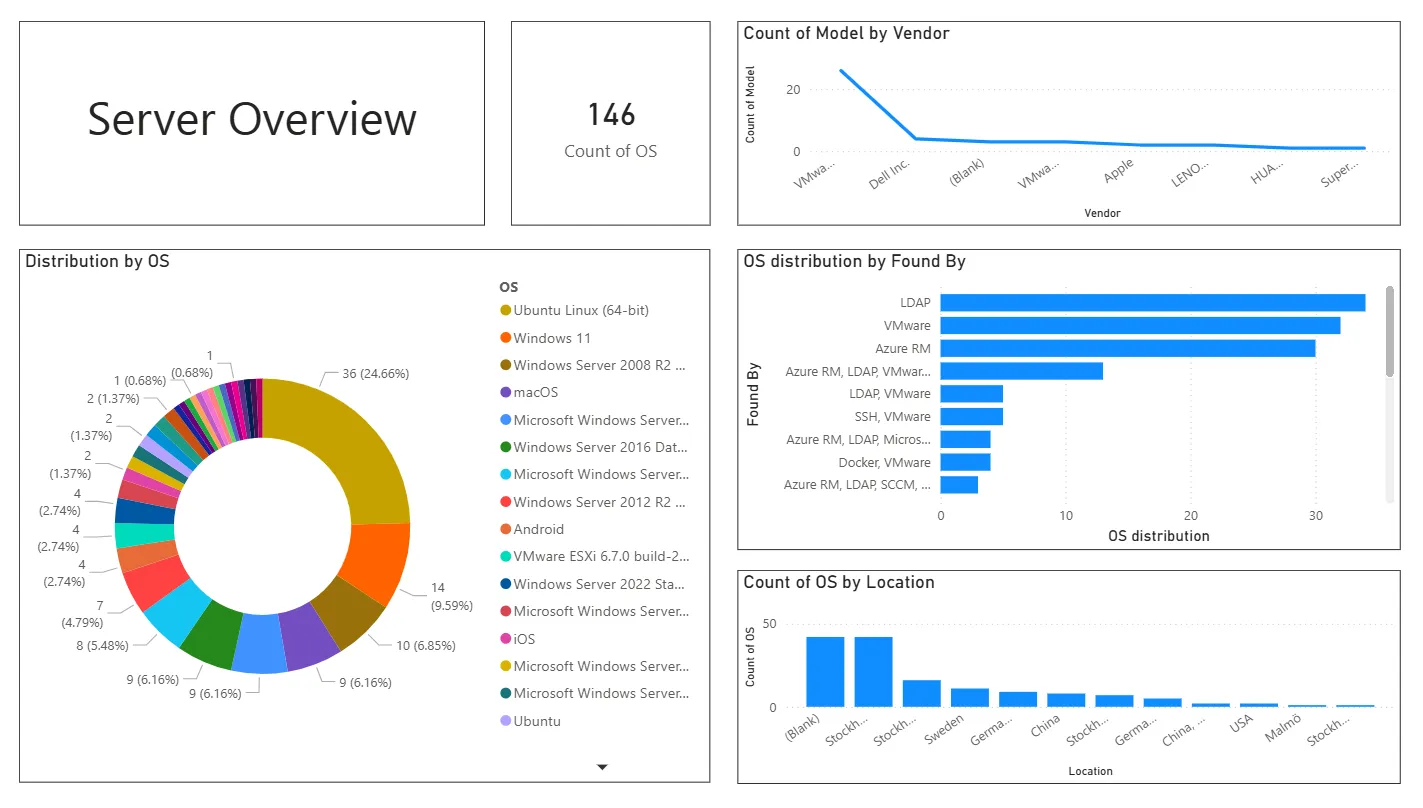
Section titled “Visualize the Data”You can now use Power BI’s features to create charts, reports, and dashboards with your imported data. The table you created in vScope serves as a dynamic data source – any updates in vScope (like new columns or filters) will reflect in Power BI upon refresh.
- Add Columns: Add new columns or filters to the vScope table.
- Save and Refresh: Save your table changes in vScope, then click Refresh in Power BI to sync data updates.
This integration helps you take full advantage of vScope’s data for automated reporting and visualization, keeping insights available and up-to-date across your organization. For more info on how to get started and build reports with Power BI, check out this guide: Get started.
vScope Template App Setup
Section titled “vScope Template App Setup”- Requirements:
- An active vScope installation
- PowerBI account that allows you to download template apps.
- vScope API token.
- vScope server URL
- Download the app from the marketplace
- Open the app
- Connect your own data:
- Press the yellow banner at the top of the page that says Connect your own data.
- You will be prompted to enter parameter information:
vScopeToken(The API token created in vScope)vScopeServerURL(Your vScope server url)
- Choose your authentication method (Anonymous usually works fine).
- For the Privacy Level, we recommend selecting Private.
- Click sign in and connect.
- Done! You should now be able to see the reports populated with your own data.
Troubleshoot
Section titled “Troubleshoot”Failed to update data source credentials
Double-check your credentials, API token, and URL. Make sure the URL matches the exact format required by the connector and that the token hasn’t expired.
Authentication method fails
Try changing your Privacy Level setting to Public, and ensure that you select Anonymous as the authentication method (if your connector requires it).
If you still receive an error, refresh Power BI Desktop or re-enter the connection information.
My reports are breaking
You can always edit the template reports that come with the app. In Power BI, open the report, switch to Edit mode to adjust how visuals are built and structured.
Firewall or network restrictions
Some environments block external API traffic.
Check with your IT team if outbound requests to the vScope API are allowed.