In Table Explorer we can build reports and tables that are dynamically updated. This means that the table is designed once and then reuses the “recipe” to always have relevant information at hand. There are many similarities to working with spreadsheets and the experienced spreadsheet user will quickly feel comfortable.
1. Overview
In the “Explore view” of Table Explorer it’s possible to build tables with information about the resources discovered by vScope. There are three basic steps to follow to build a table:
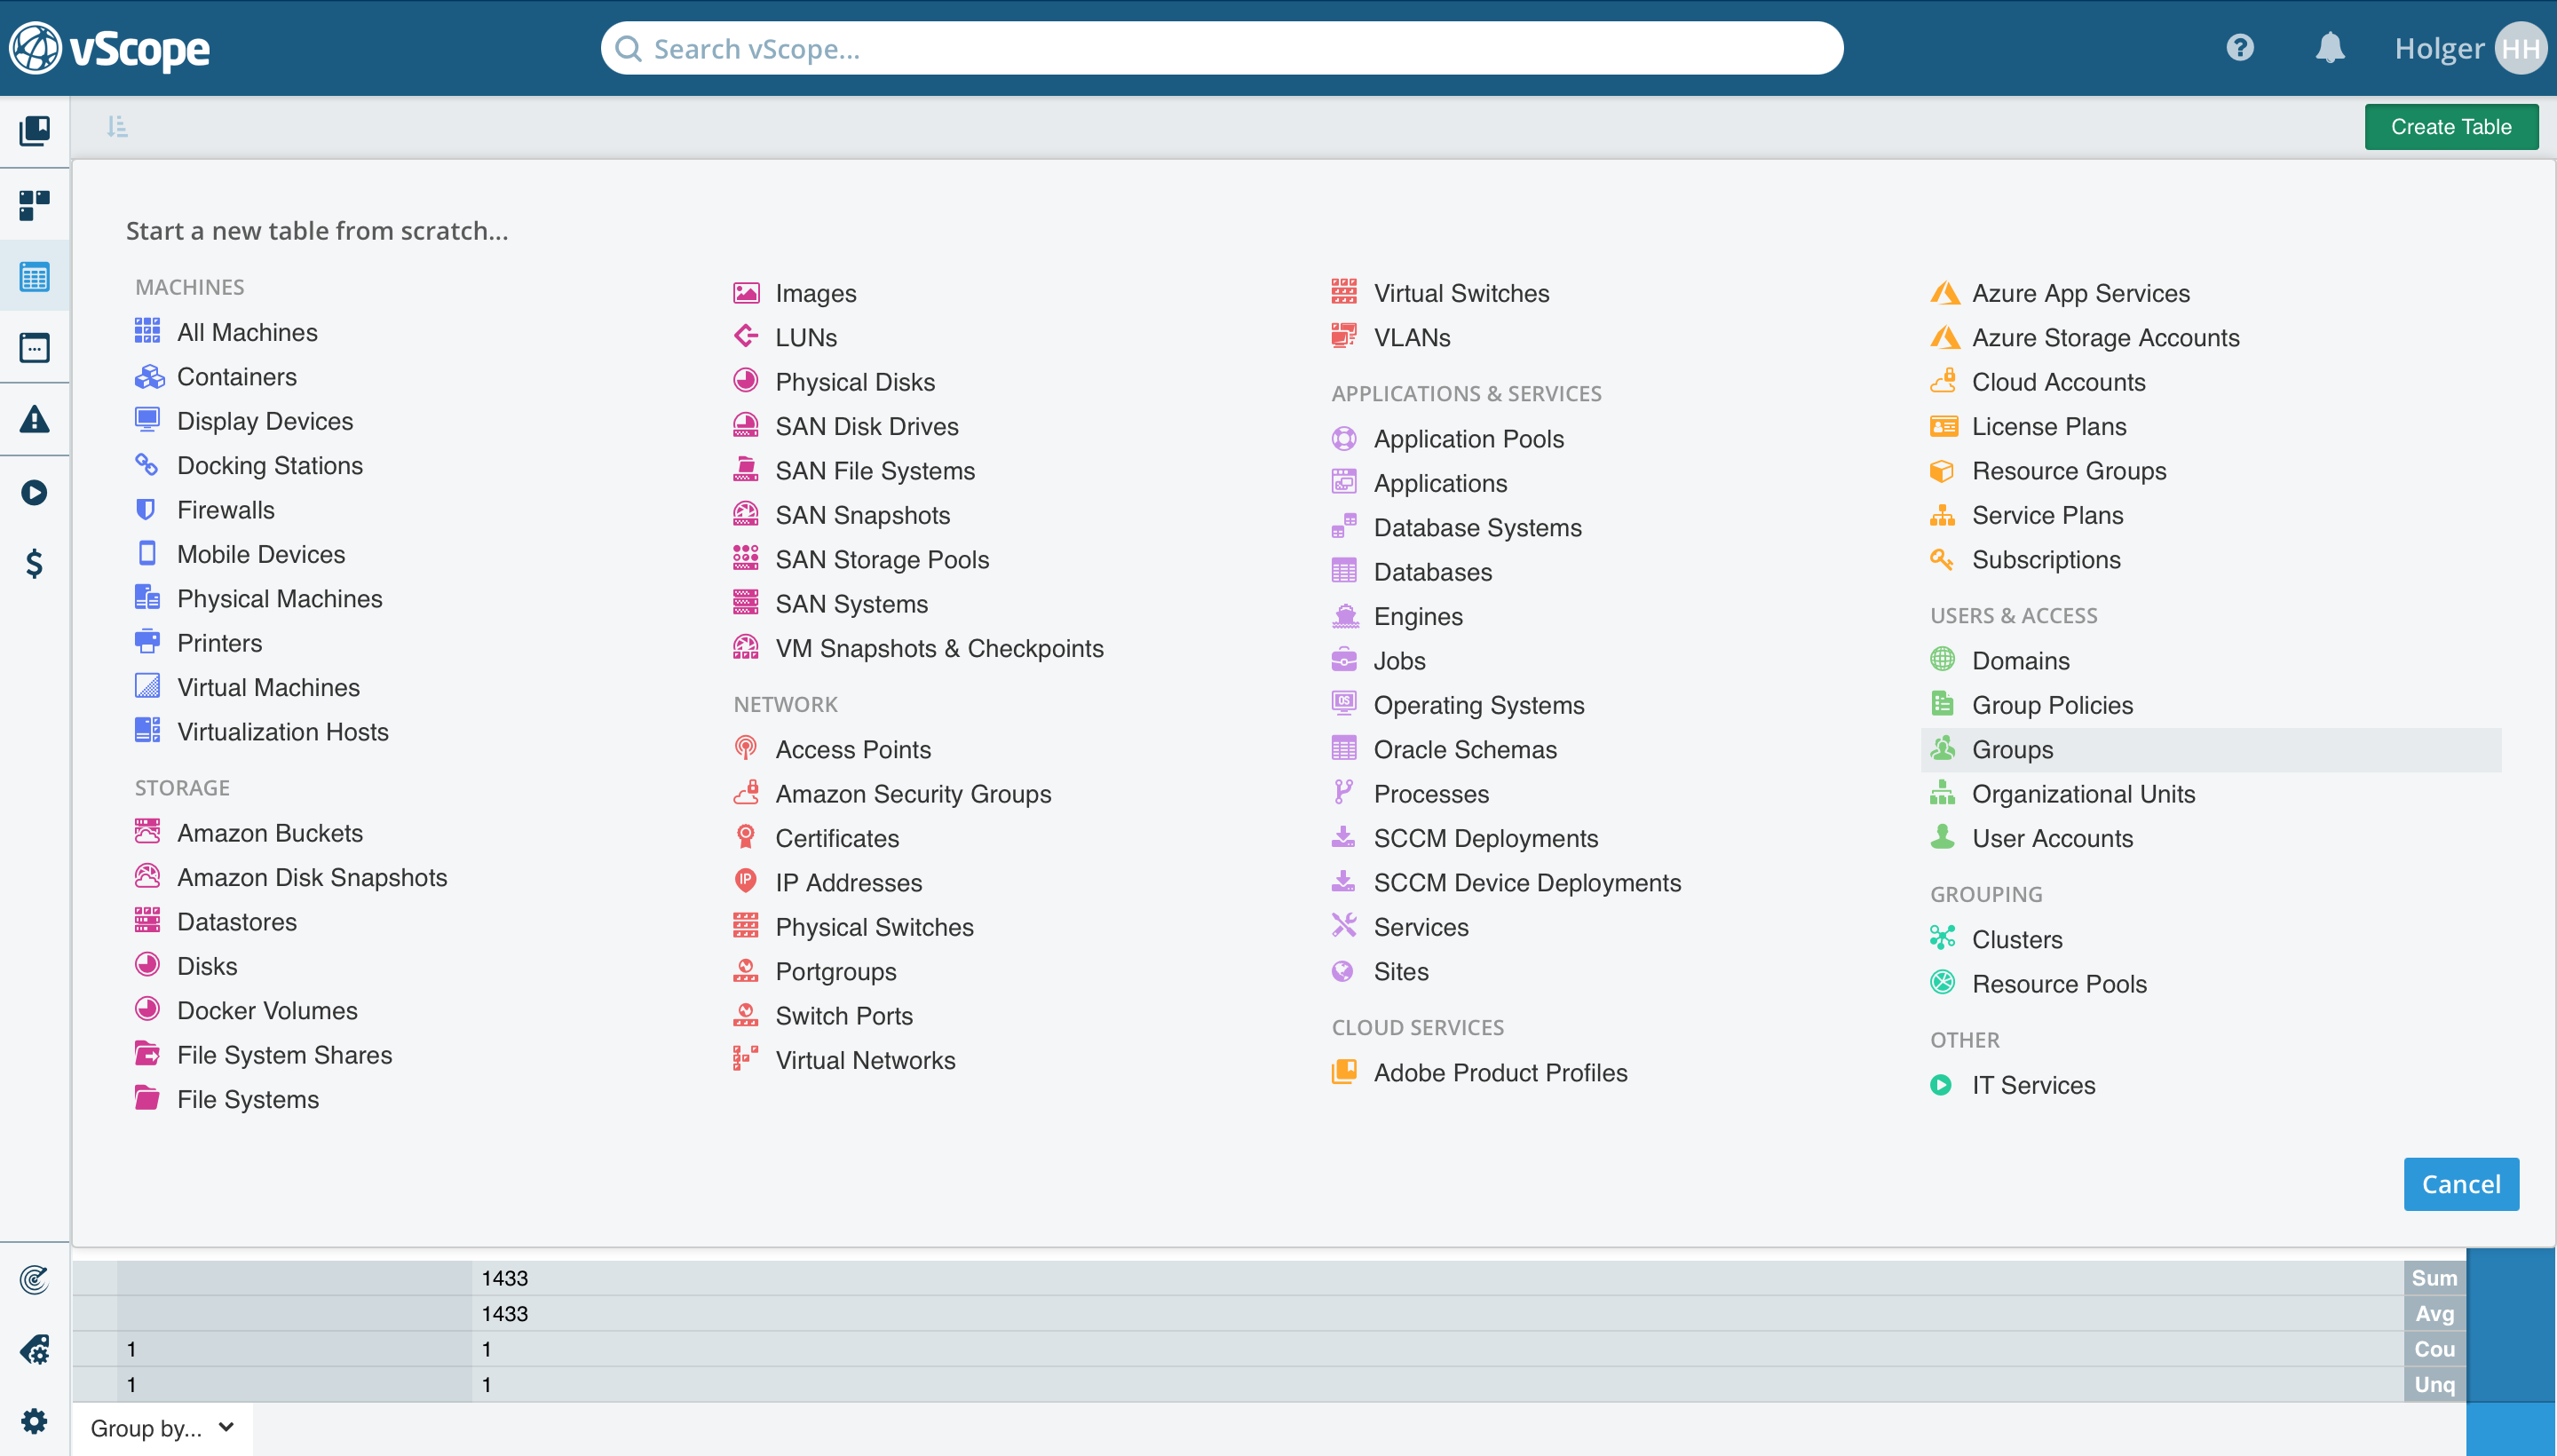
- Click “New Table” and select a resource
- Choose columns (what information would to view)
- Filter the view
1.1. Resource
Every table is based on a resource. This is the “theme” of the table. See the main resource of a table in the top left corner (above the table name), in this case “All Machines”
Create a new table at any time in Table Explorer by clicking “Create Table”-button in the right corner and “Show all asset types” select the resource.
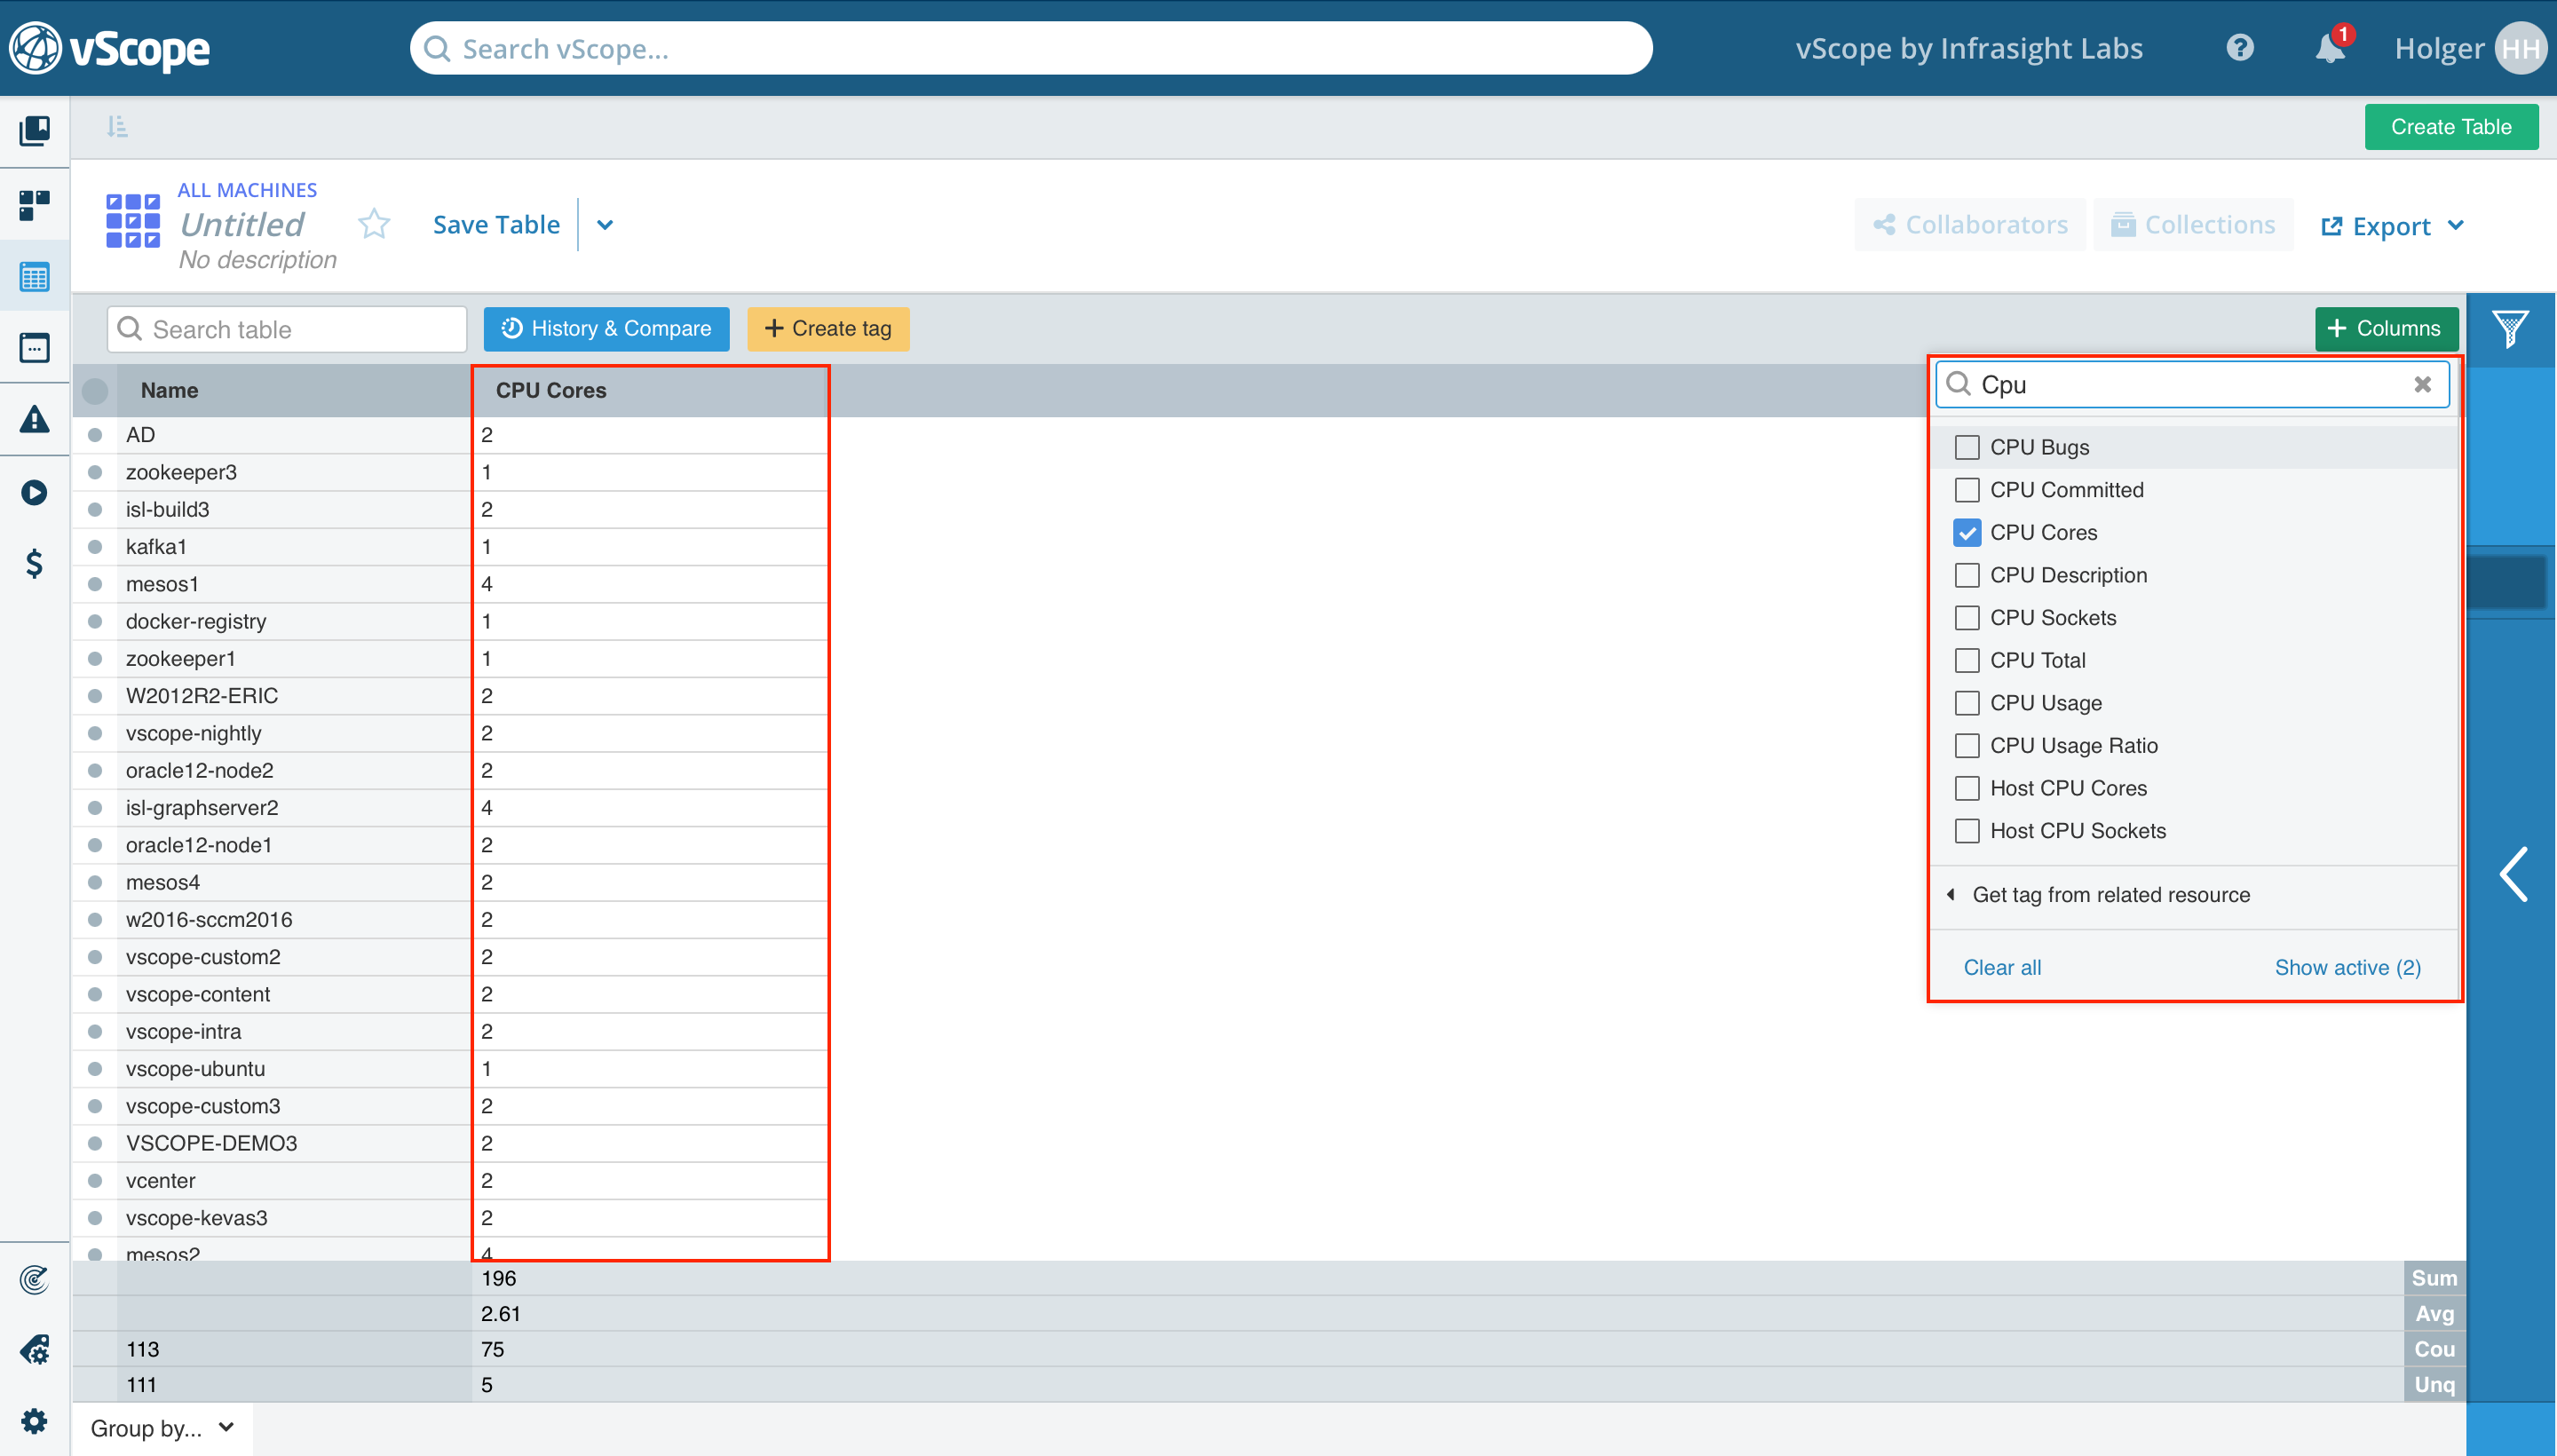
1.2. Columns
Columns are tags and information that relates to the table resource. It can be an IP address, applications, connections, name, RAM or anything else that needs to be included in the table. Add columns by clicking the green “+”-button to the right in the table header. Notice that the information added does not have to be directly related to the selected resource. It can also be from a neighboring resource such as certificates, databases, storage or Active Directory.
1.3. Filters
No scripting skills are required when filtering in vScope. Filters are simply added by clicking on them. The filter panel is the blue section to the right in Table Explorer.
- Decide what tag (column) to filter on
- Expand the tag name
- Select the value(s) that needs filtering
Notice that the actual tag does not have to be added to the table in order to filter on it. Simply click the boxes to add filters. If clicked twice a “NOT” filter is added.
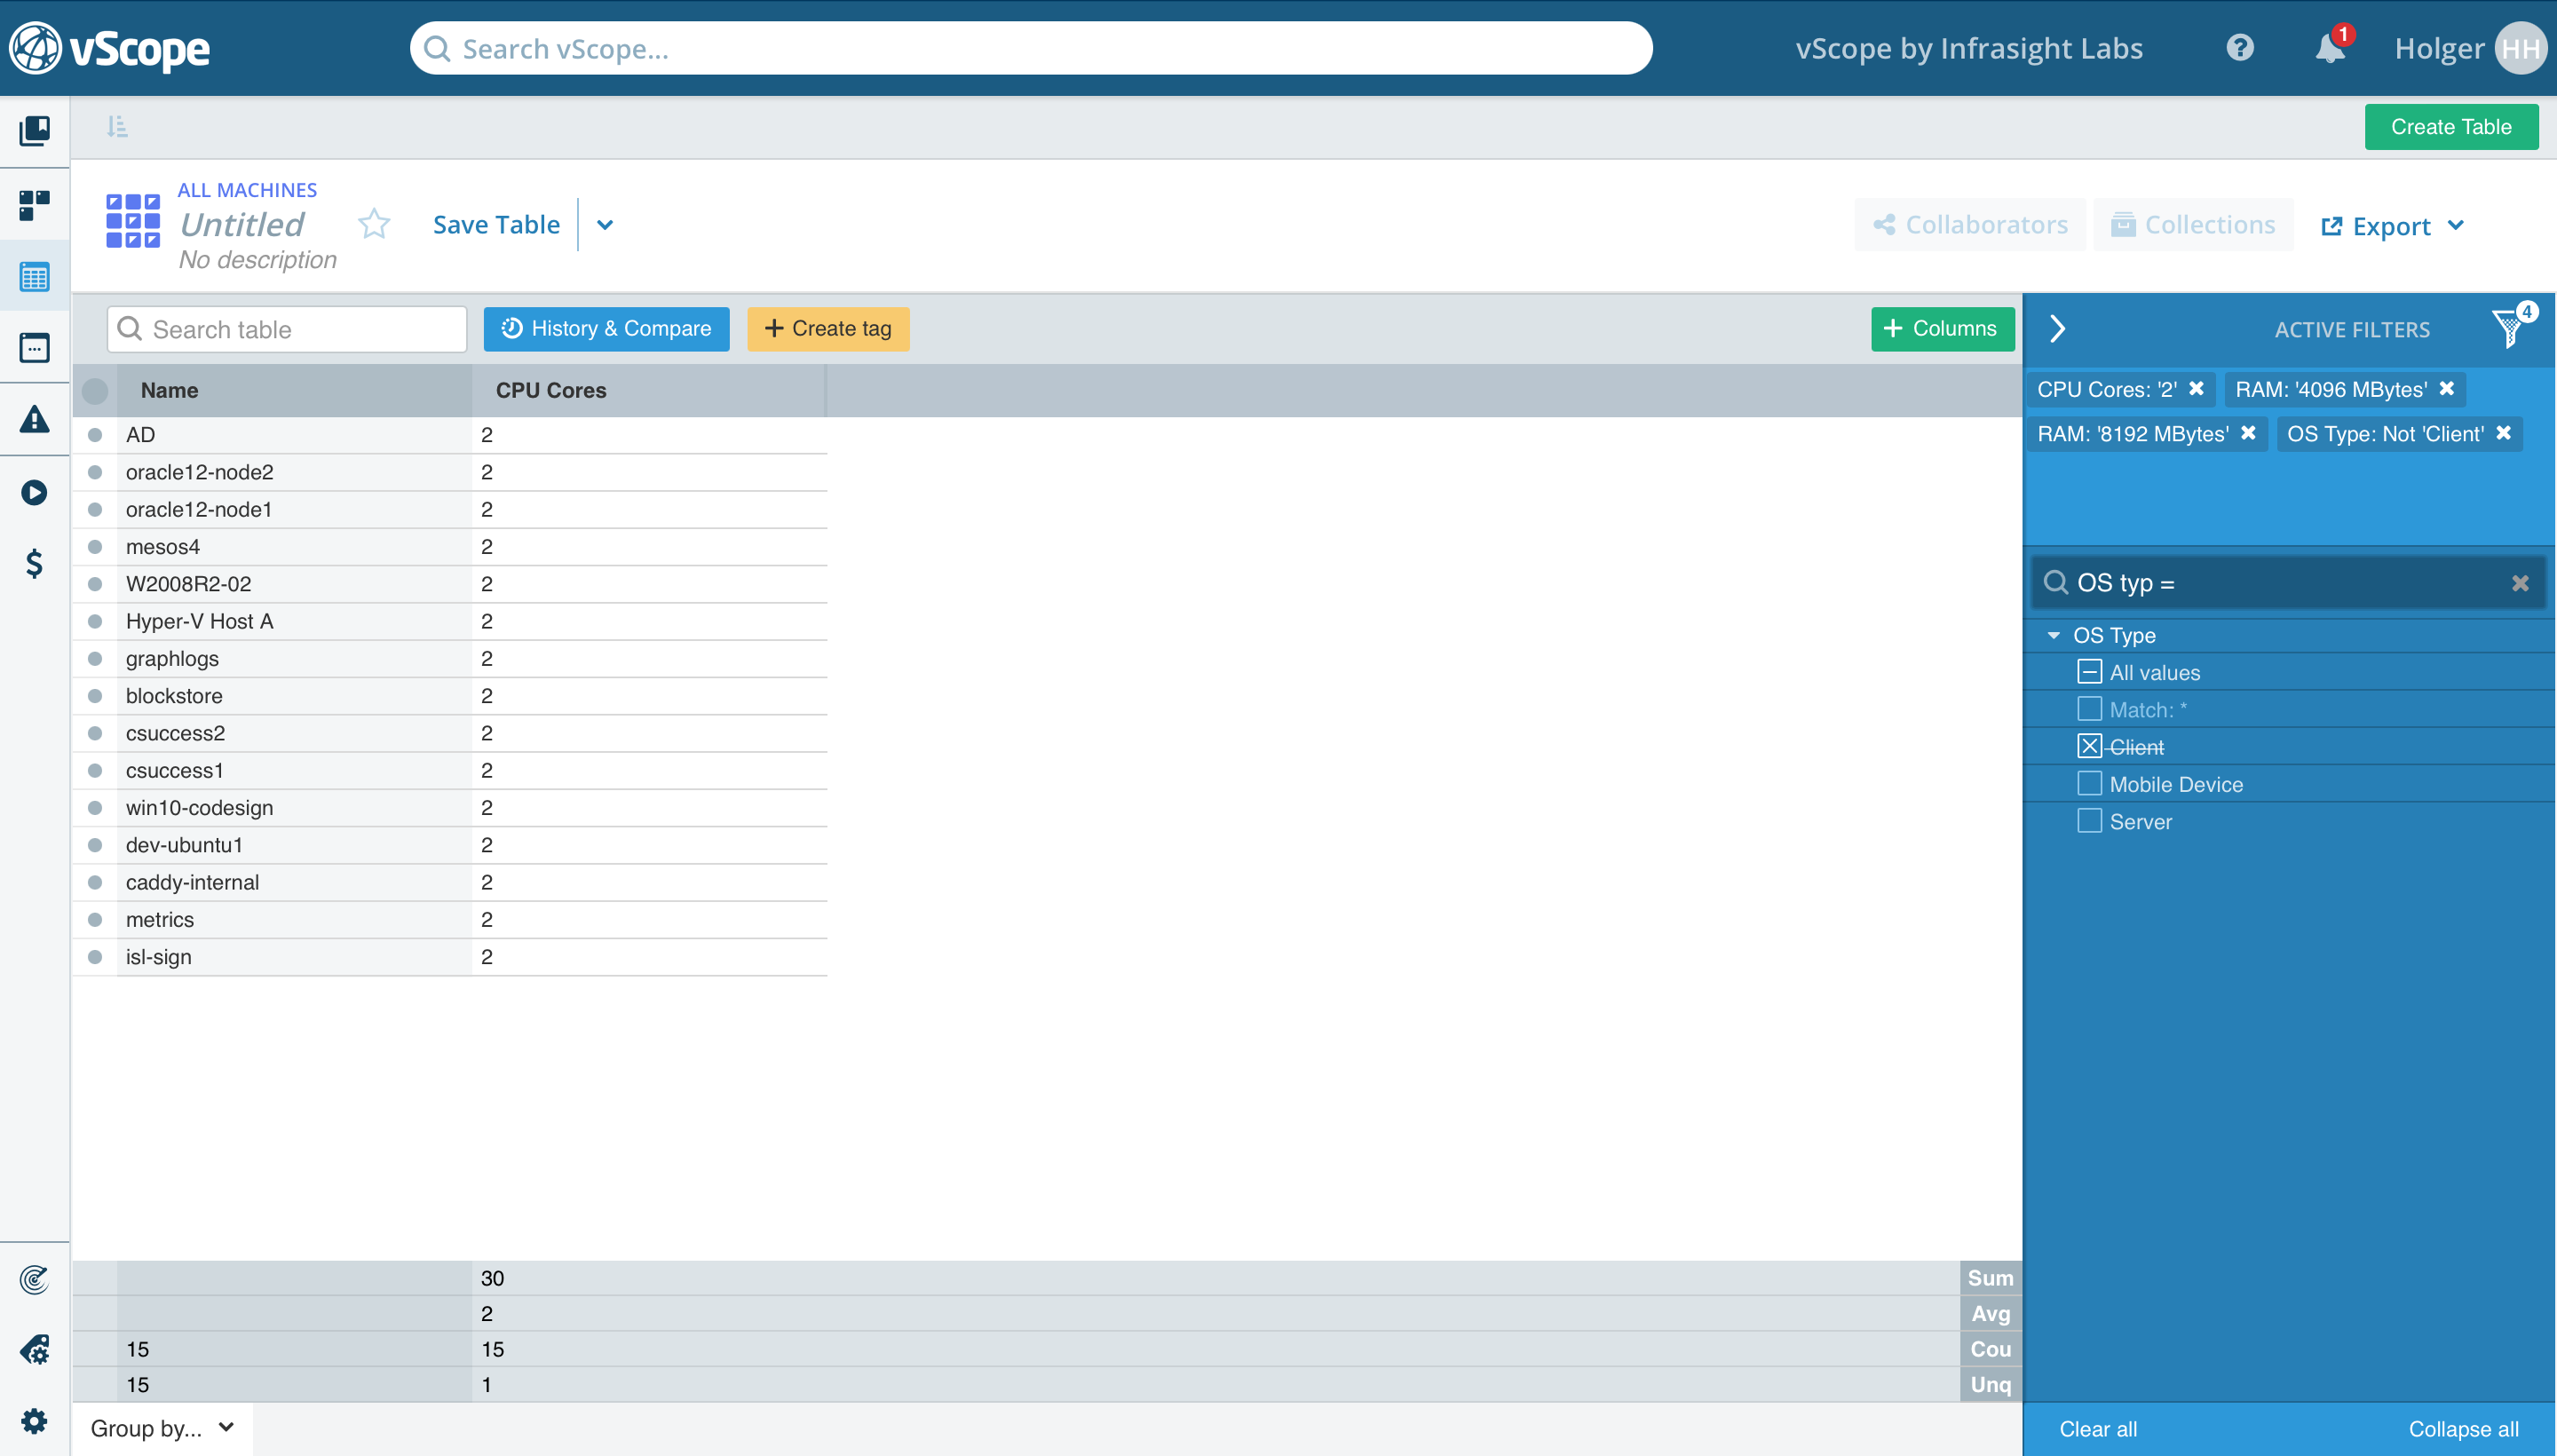
In the image below there are four filters added:
- Show All Machines (the resources type) with 2 CPU Cores
AND - Show All Machines with 4096 MBytes OR 8192 MBytes of RAM
AND - Hide All Machines wher OS Type is NOT Client (click twice in the checkbox OS Type – Client)
1.3.1 Different filters
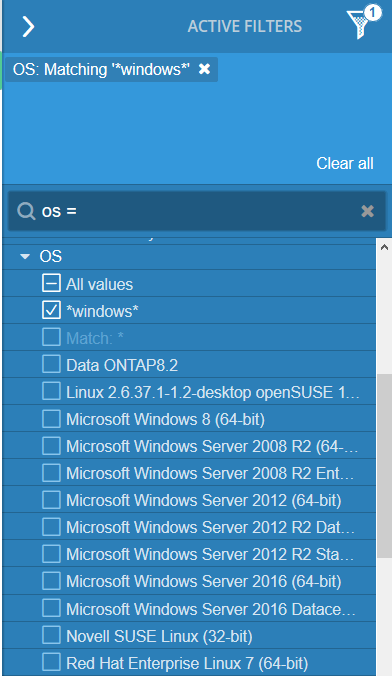
1.3.1.1 Match filters
The match filter can be used to match *values* that may not have the exakt same name. The match filter in the image below tells vScope to show all machines where OS = “*windows*”. With this every OS value that matches “Windows” will be shown in the table.
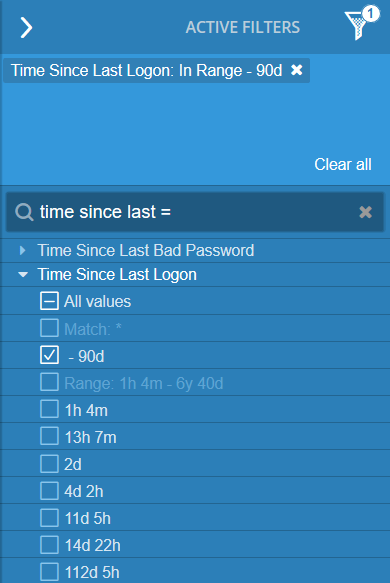
1.3.1.2. Range & Date filters
Filter on ranges and dates. For example only view accounts that have been used the last 90 days (- 90).
y = years
d = days
h = hours
m = minutes
s = seconds
1.3.1.3. Regex filters
Regex filters are more advance than the basic filter options. Read more about regex in vScope here.
2. Additional features
A table can be further customized using tabs and history.
2.1 Group By
Grouping a table will create a tab for each unique value of a tag (column). This is very convenient in order to quickly categorize resources.
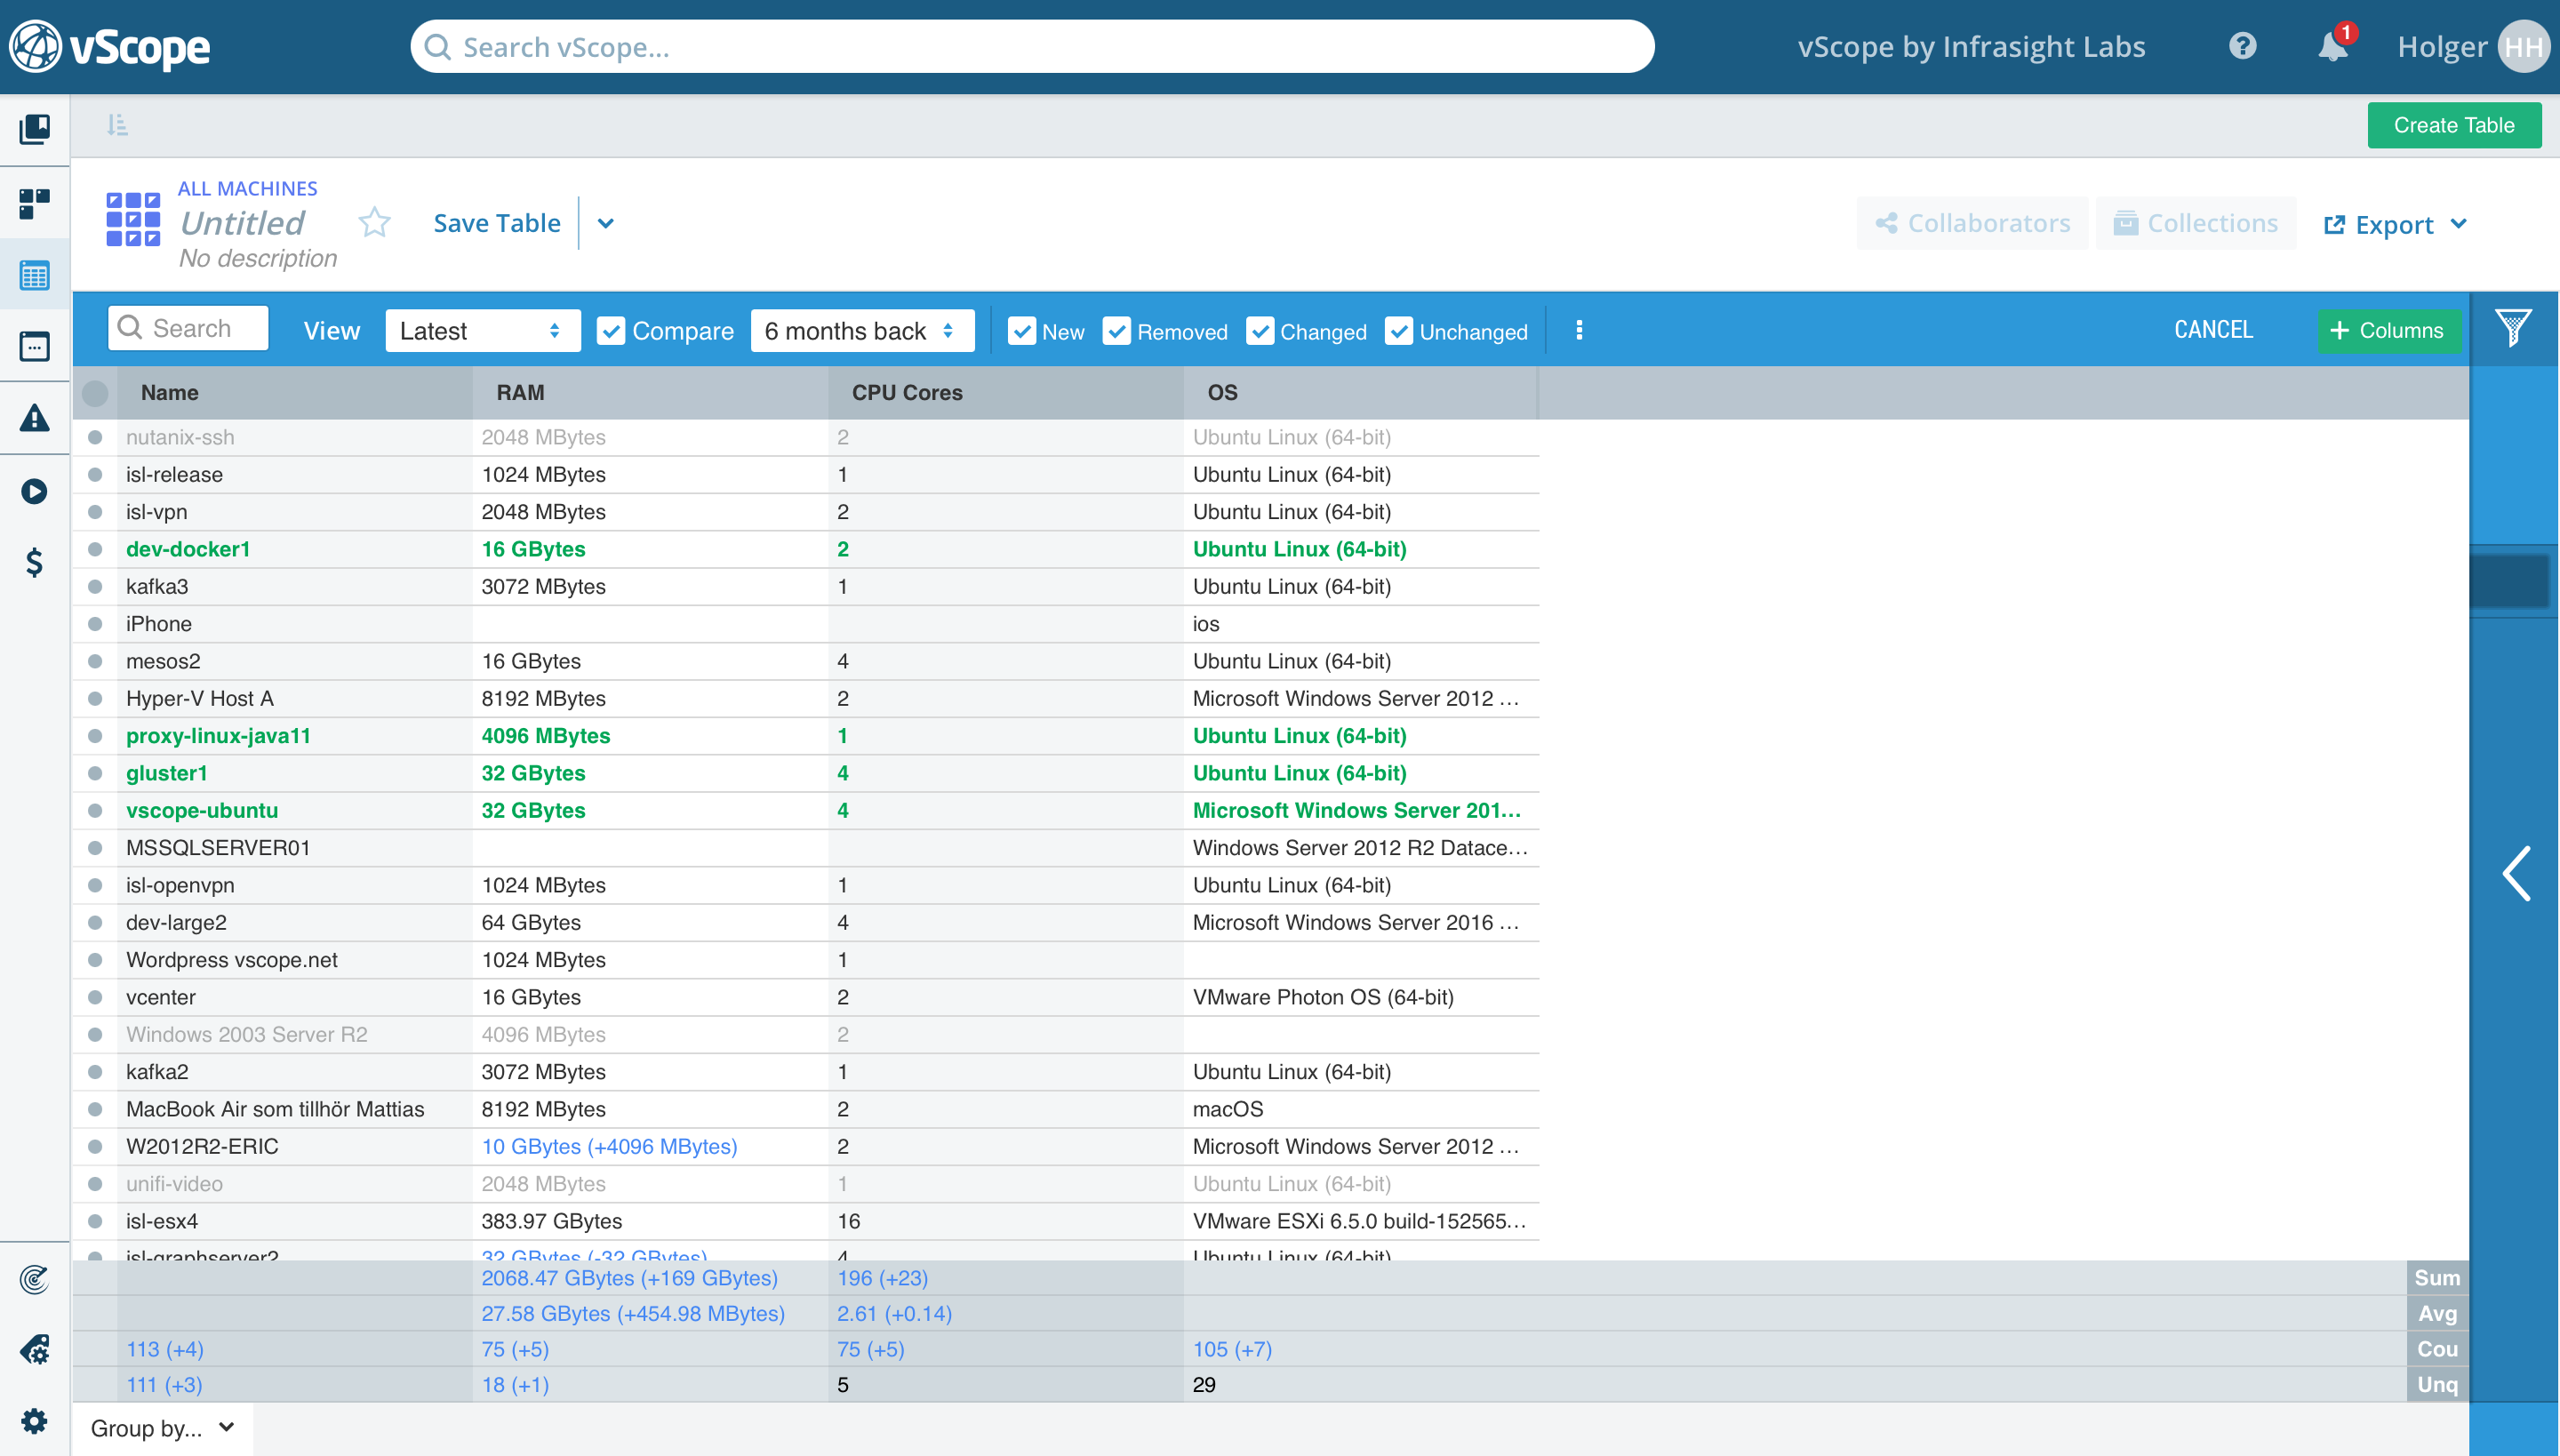
2.2. History & Compare
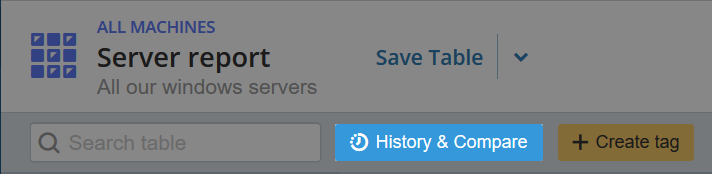
History & Compare provides the power to compare two revisions of a table. This is a very powerful feature in order to view changes and identify trends of the IT.
3. Actions
Once a table is built it’s possible to use it for further actions.
3.1. Save Table
By default, a table will be named “Untitled” until it is saved. Saving a table will allow for distributing tables as a report by configuring collaborators and schedule settings. Click Save Table -> Enter a table name, an optional description and hit Save. The latest version of the table will now be accessible in the library (see 4.4.).
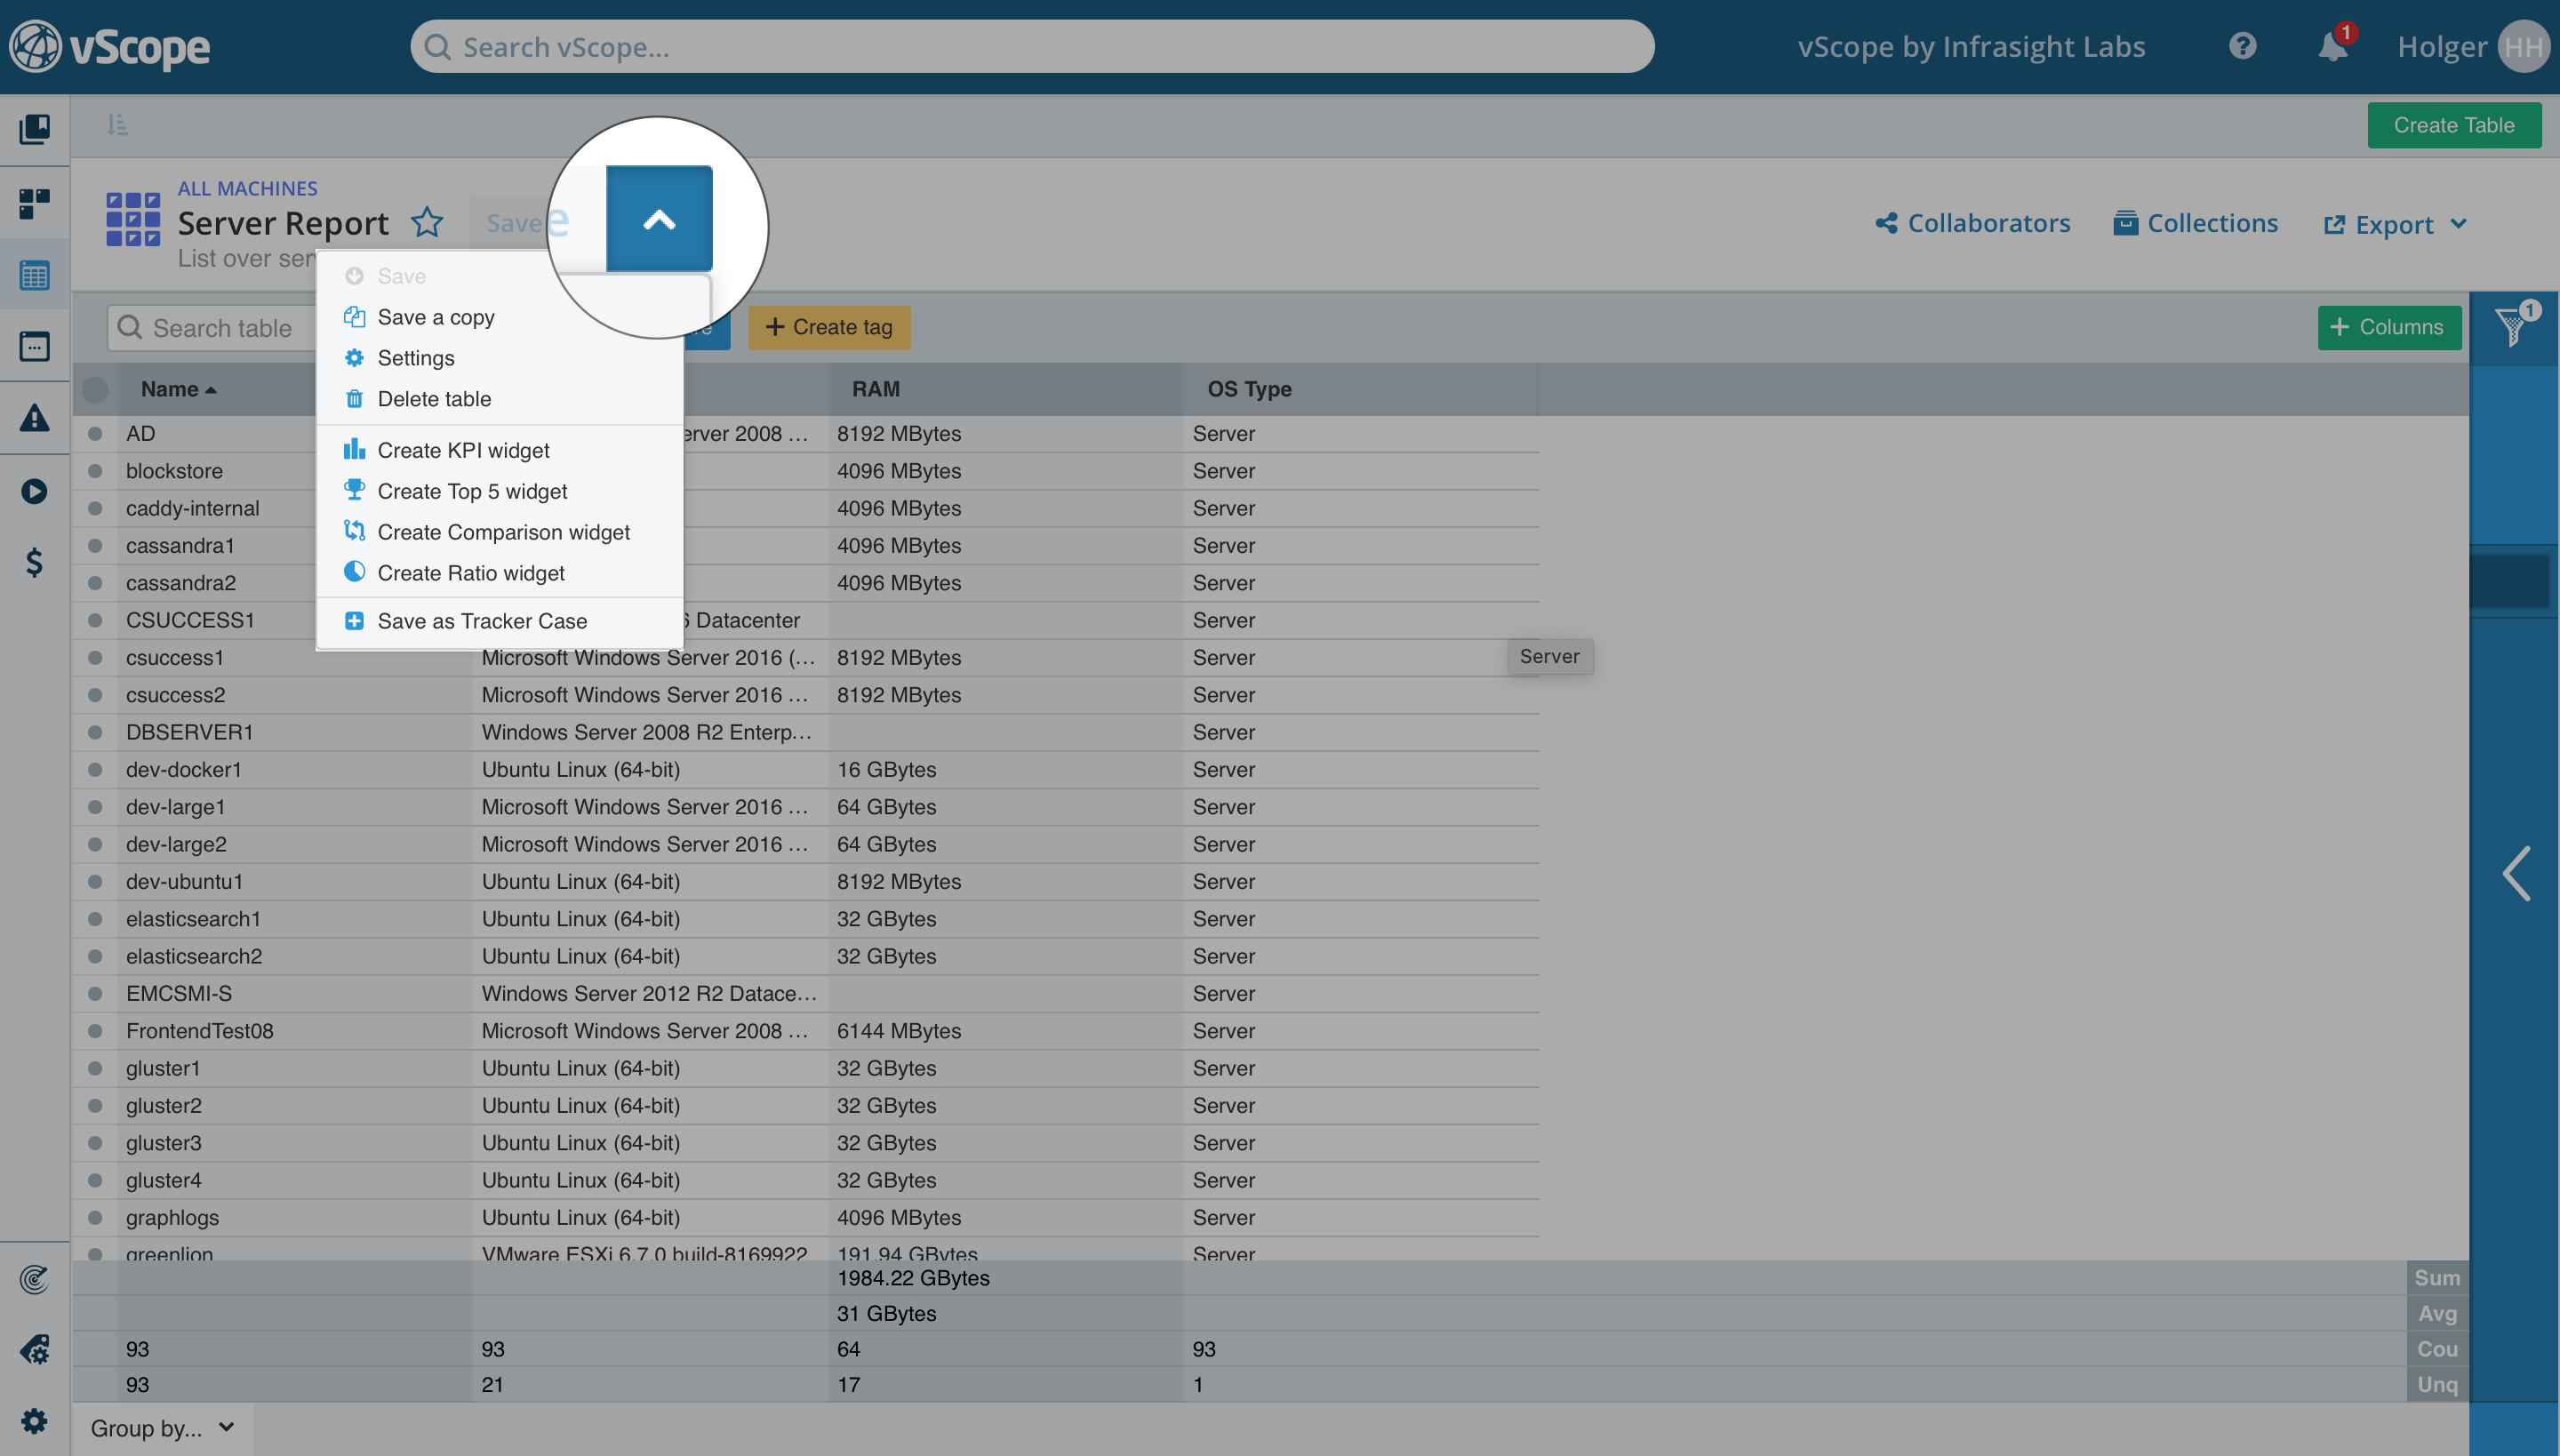
3.2. Additional table options
Use tables with the other functionalities in vScope. By clicking the arrow next to “Save Table” it is possible to create a widget and add it to a Dashboard, use it as a tracker case or save it as a copy to modify the table for another purpose.
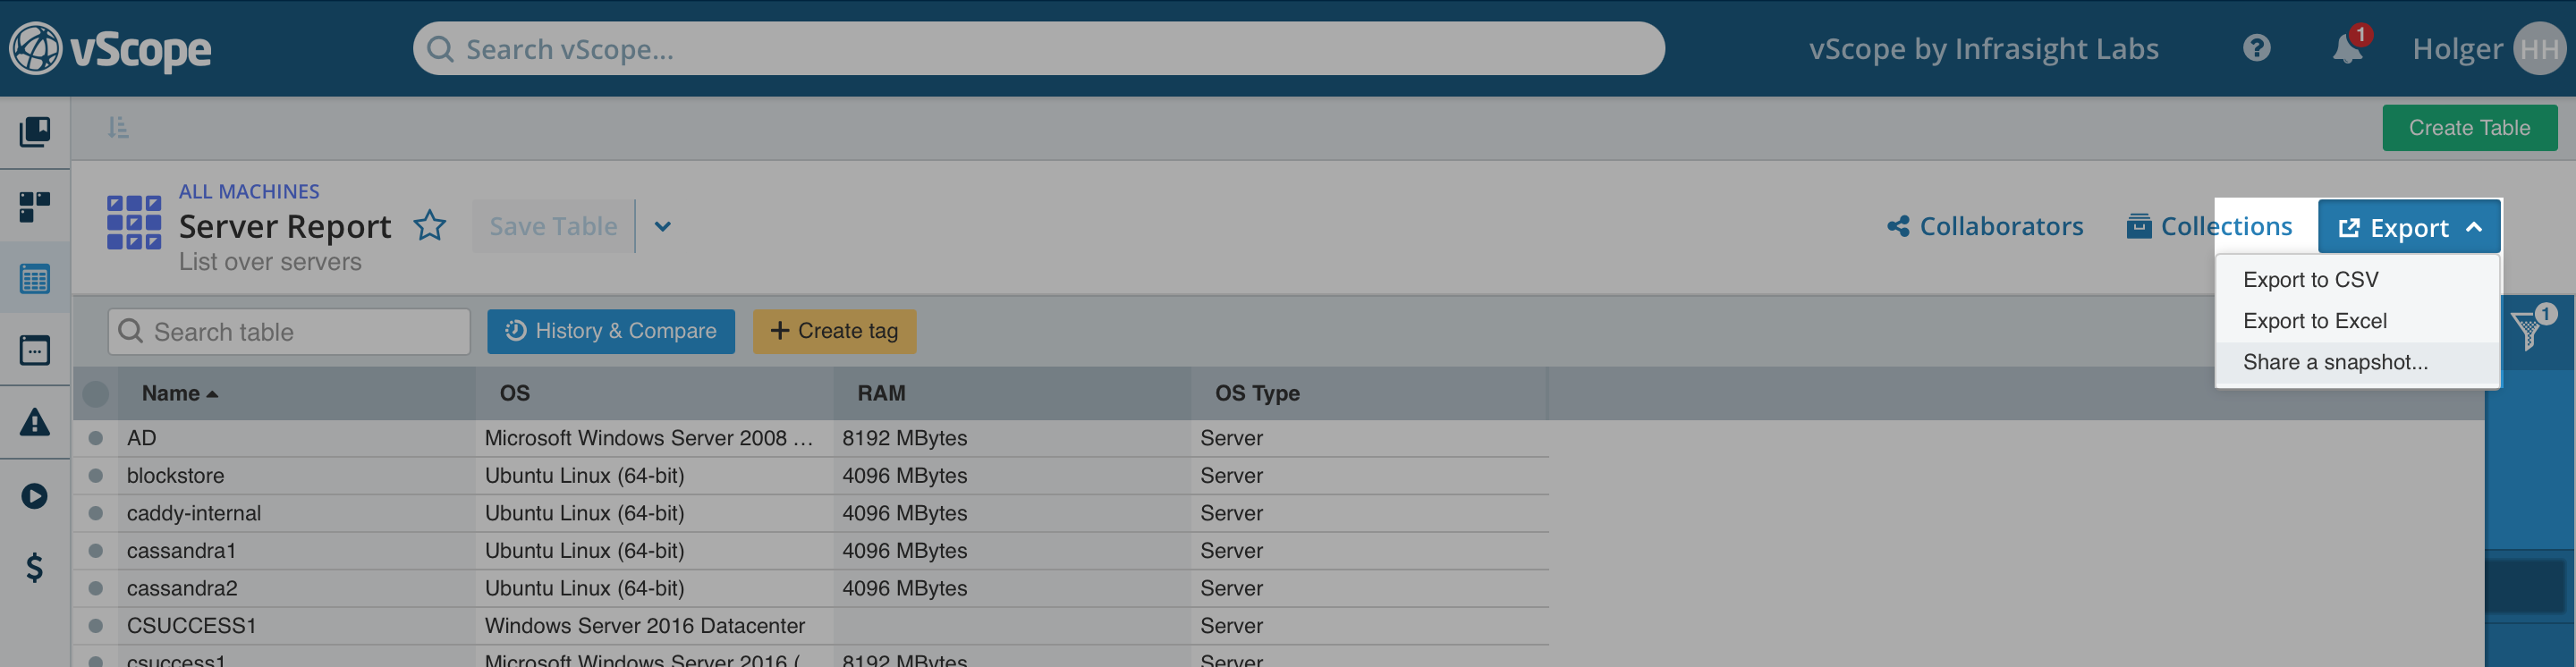
3.3. Share Snapshot
Sometimes it’s necessary to quickly to share a table with all findings. This can be done with “Share Snapshot”. Sharing a snapshot will provide a direct link that leads to an exact copy of the table at the time it was sent. This can be done by clicking the arrow next to “Export”
The snapshot includes:
- Selected resource
- Tags (columns)
- Filters added
- Group by-settings (found in the bottom left corner)
This is an easy way to allow colleagues to view reports/documentation.
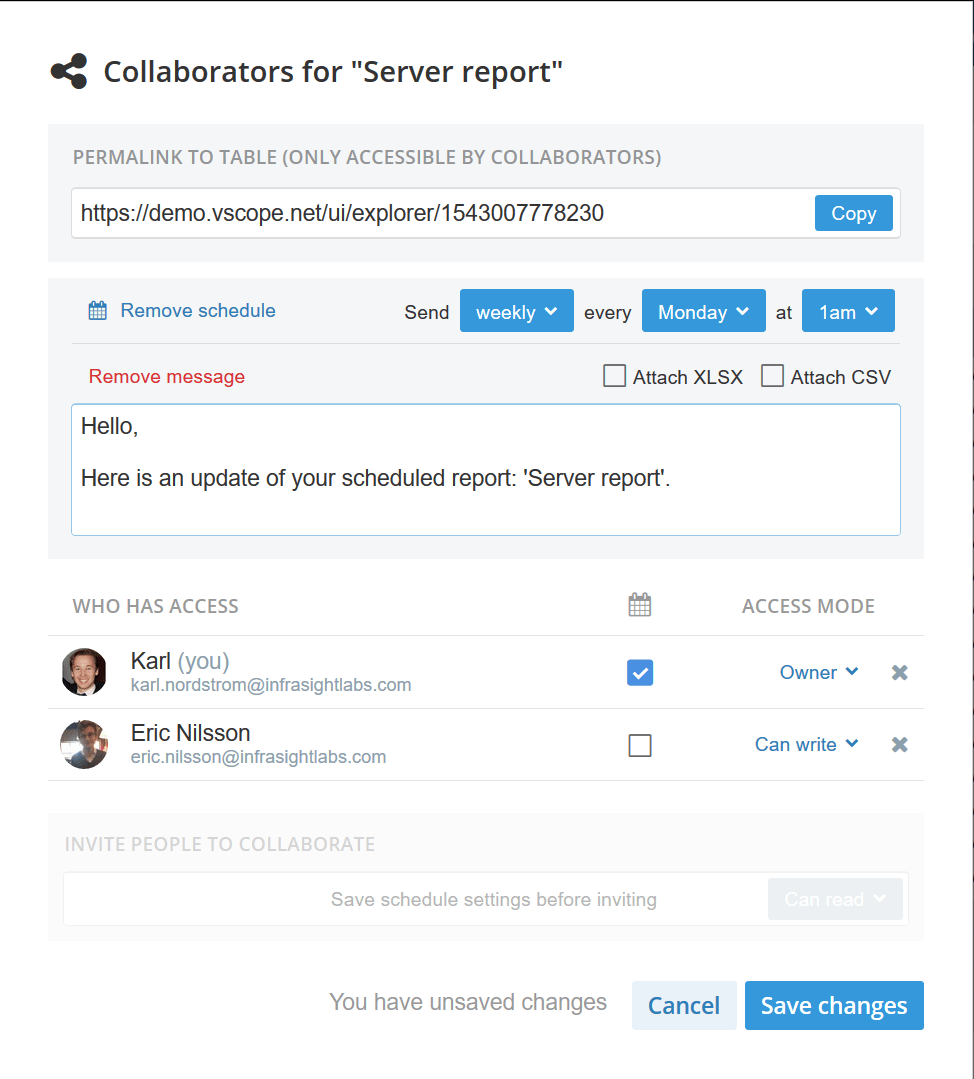
3.4. Collaboration
Collaborators are other vScope users that can access, view and edit a saved table depending on their permission level. There are no limits to the amount of collaborators. Set the permission level in the collaborators float.
3.5. Schedule report
Within the Collaboration float there’s the option to “Schedule report”. This is to schedule an email notification to any collaborator of the table. Select “Schedule report”, set a schedule and select receivers of the email update.
3.6. Export
Take the tables elsewhere and export the it to either XLSX or CSV.
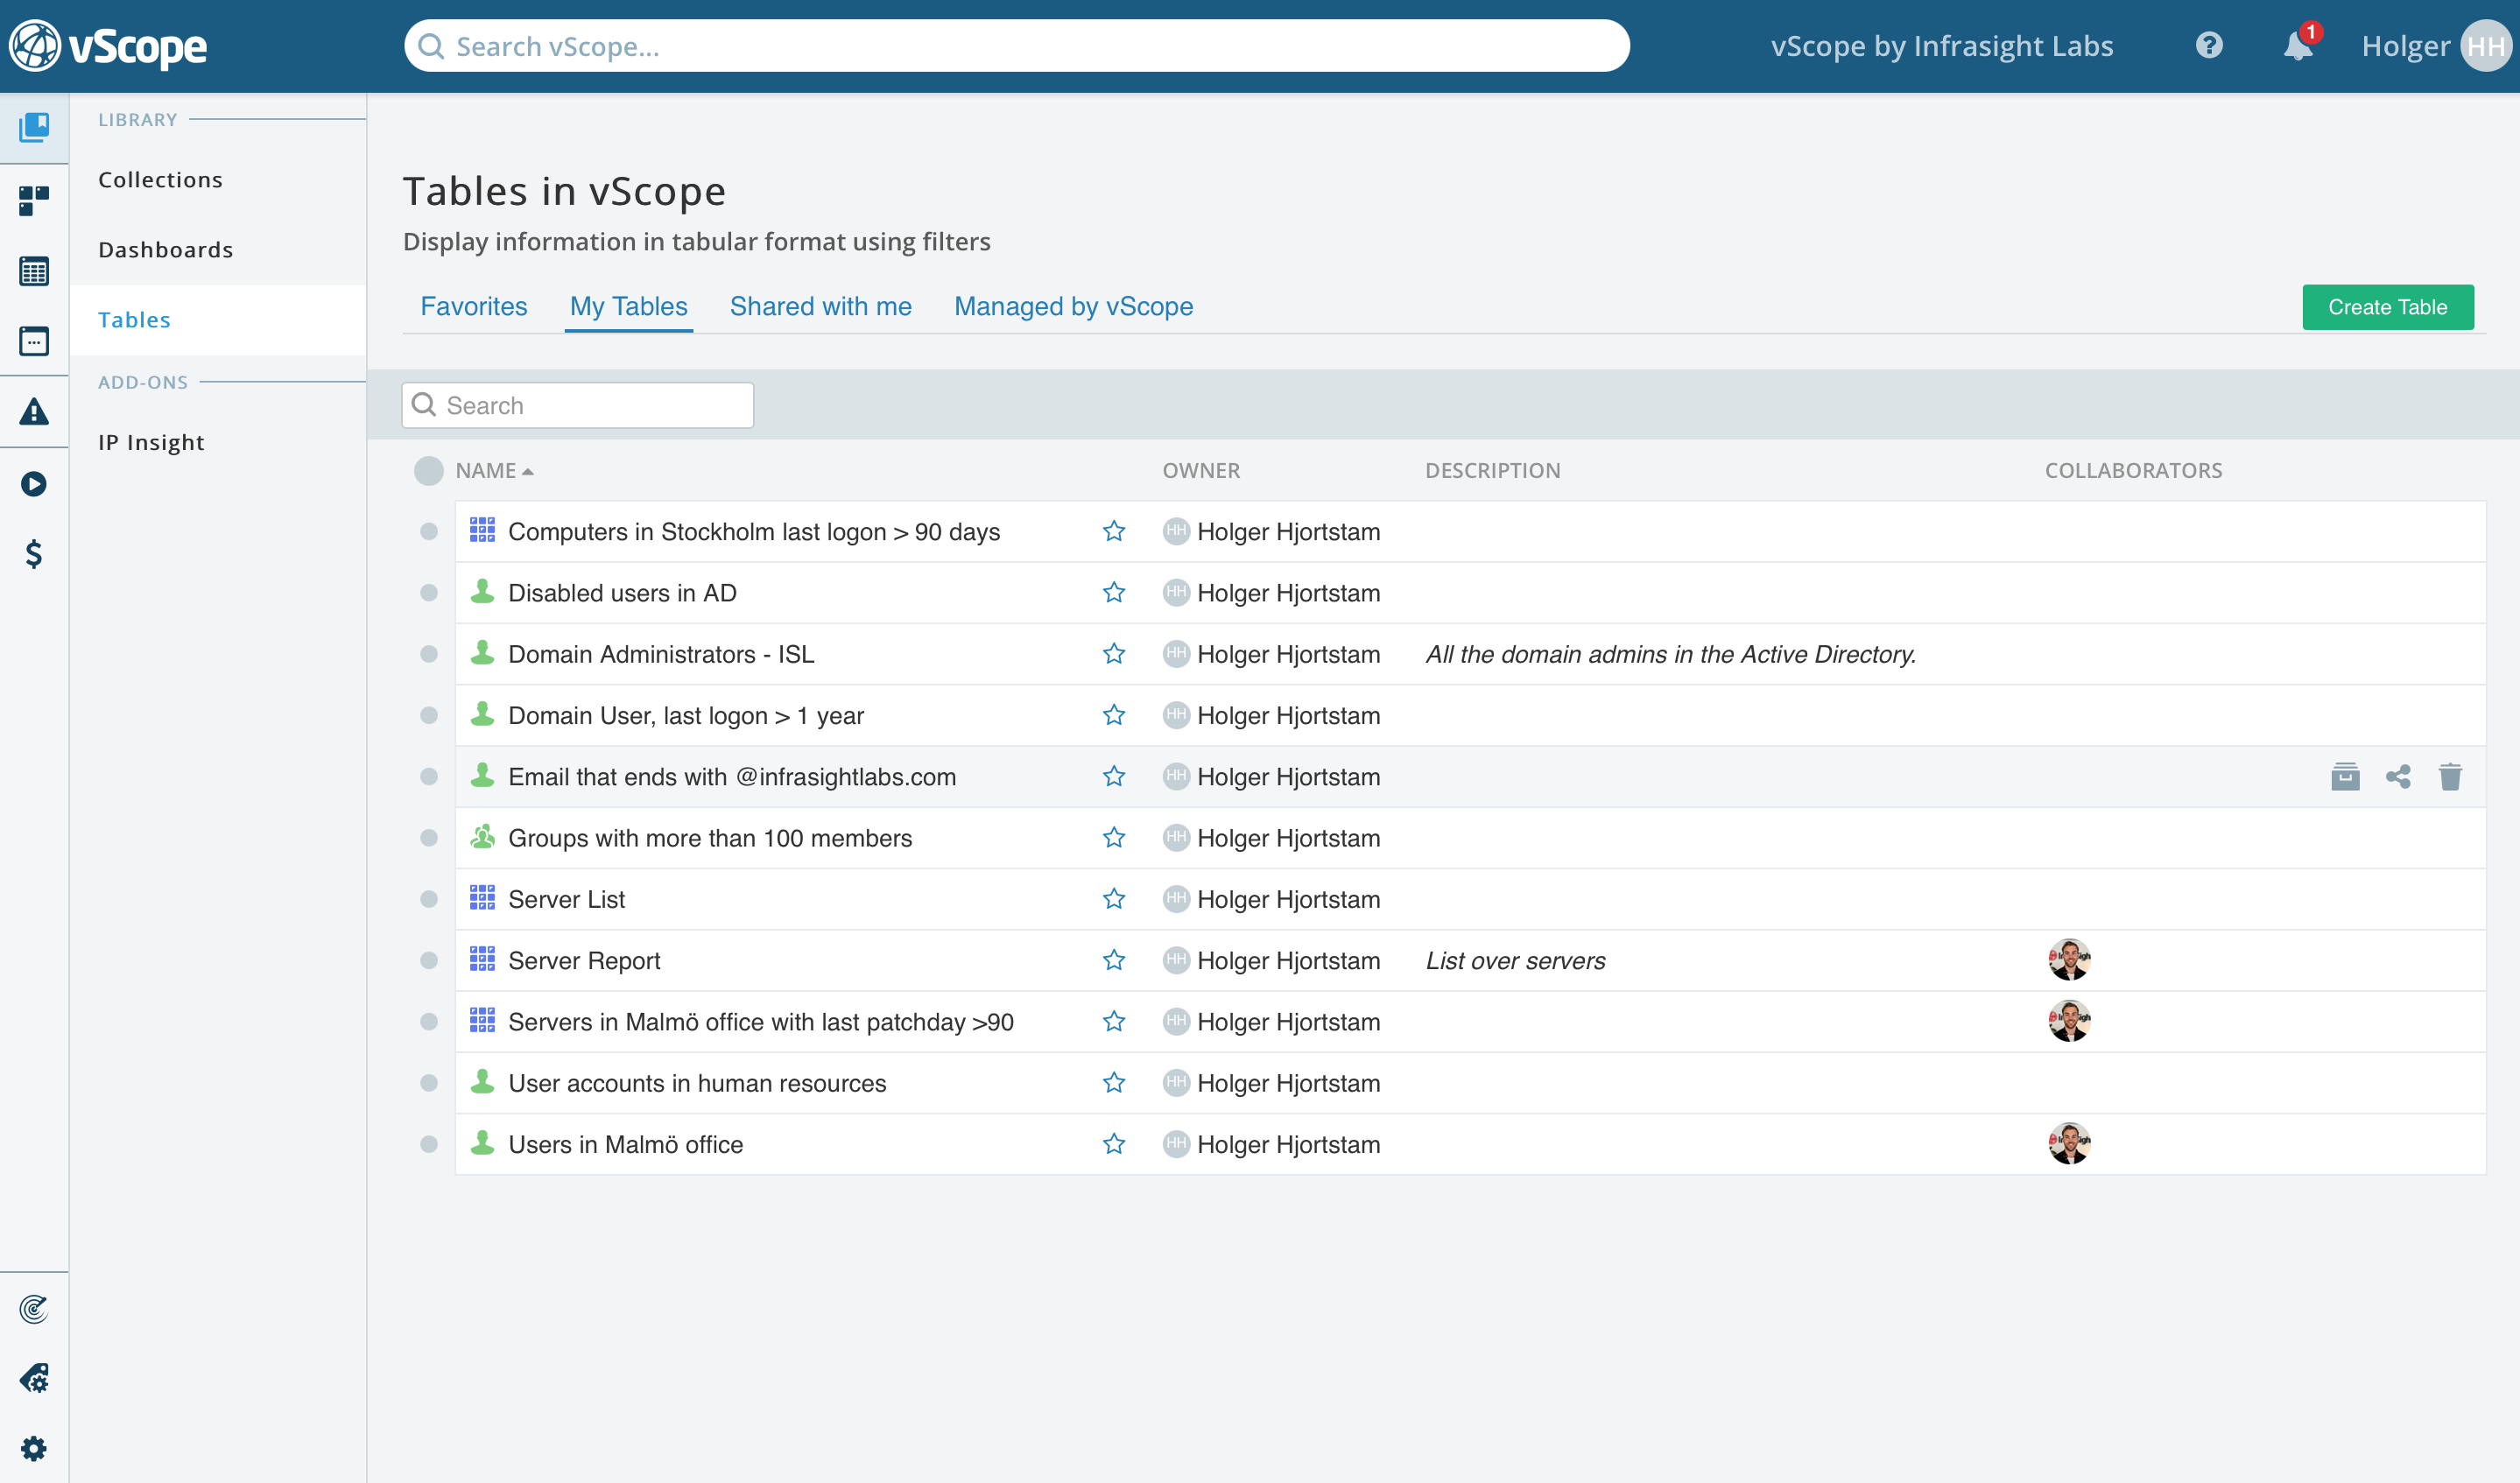
4. Browse Tables
All the saved tables are located in the library. This includes:
- Tables you have created and saved
- Tables that you are a collaborator of
- Tailored recommendations, bundled table presets built by vScope
Besides opening the different tables (by clicking on them) it’s also possible to manage collaborator settings or deleting the table (please notice that this option is only available for table owners or those with write permissions to the table).
5. Create Tag
Creating tags are central in vScope and puts the IT in a context. Clicking “Create Tag” takes the user to the tag mode where they sees a preview of the tag to be created. Filter what resources to be assigned a tag and click save.
Read more about managing tags at Tag Manager.
6. Context menu
Right click on a value in a column to open the context menu. There are several options in the menu such as viewing a resource in its Properties page, managing tags and different filtering options on the value.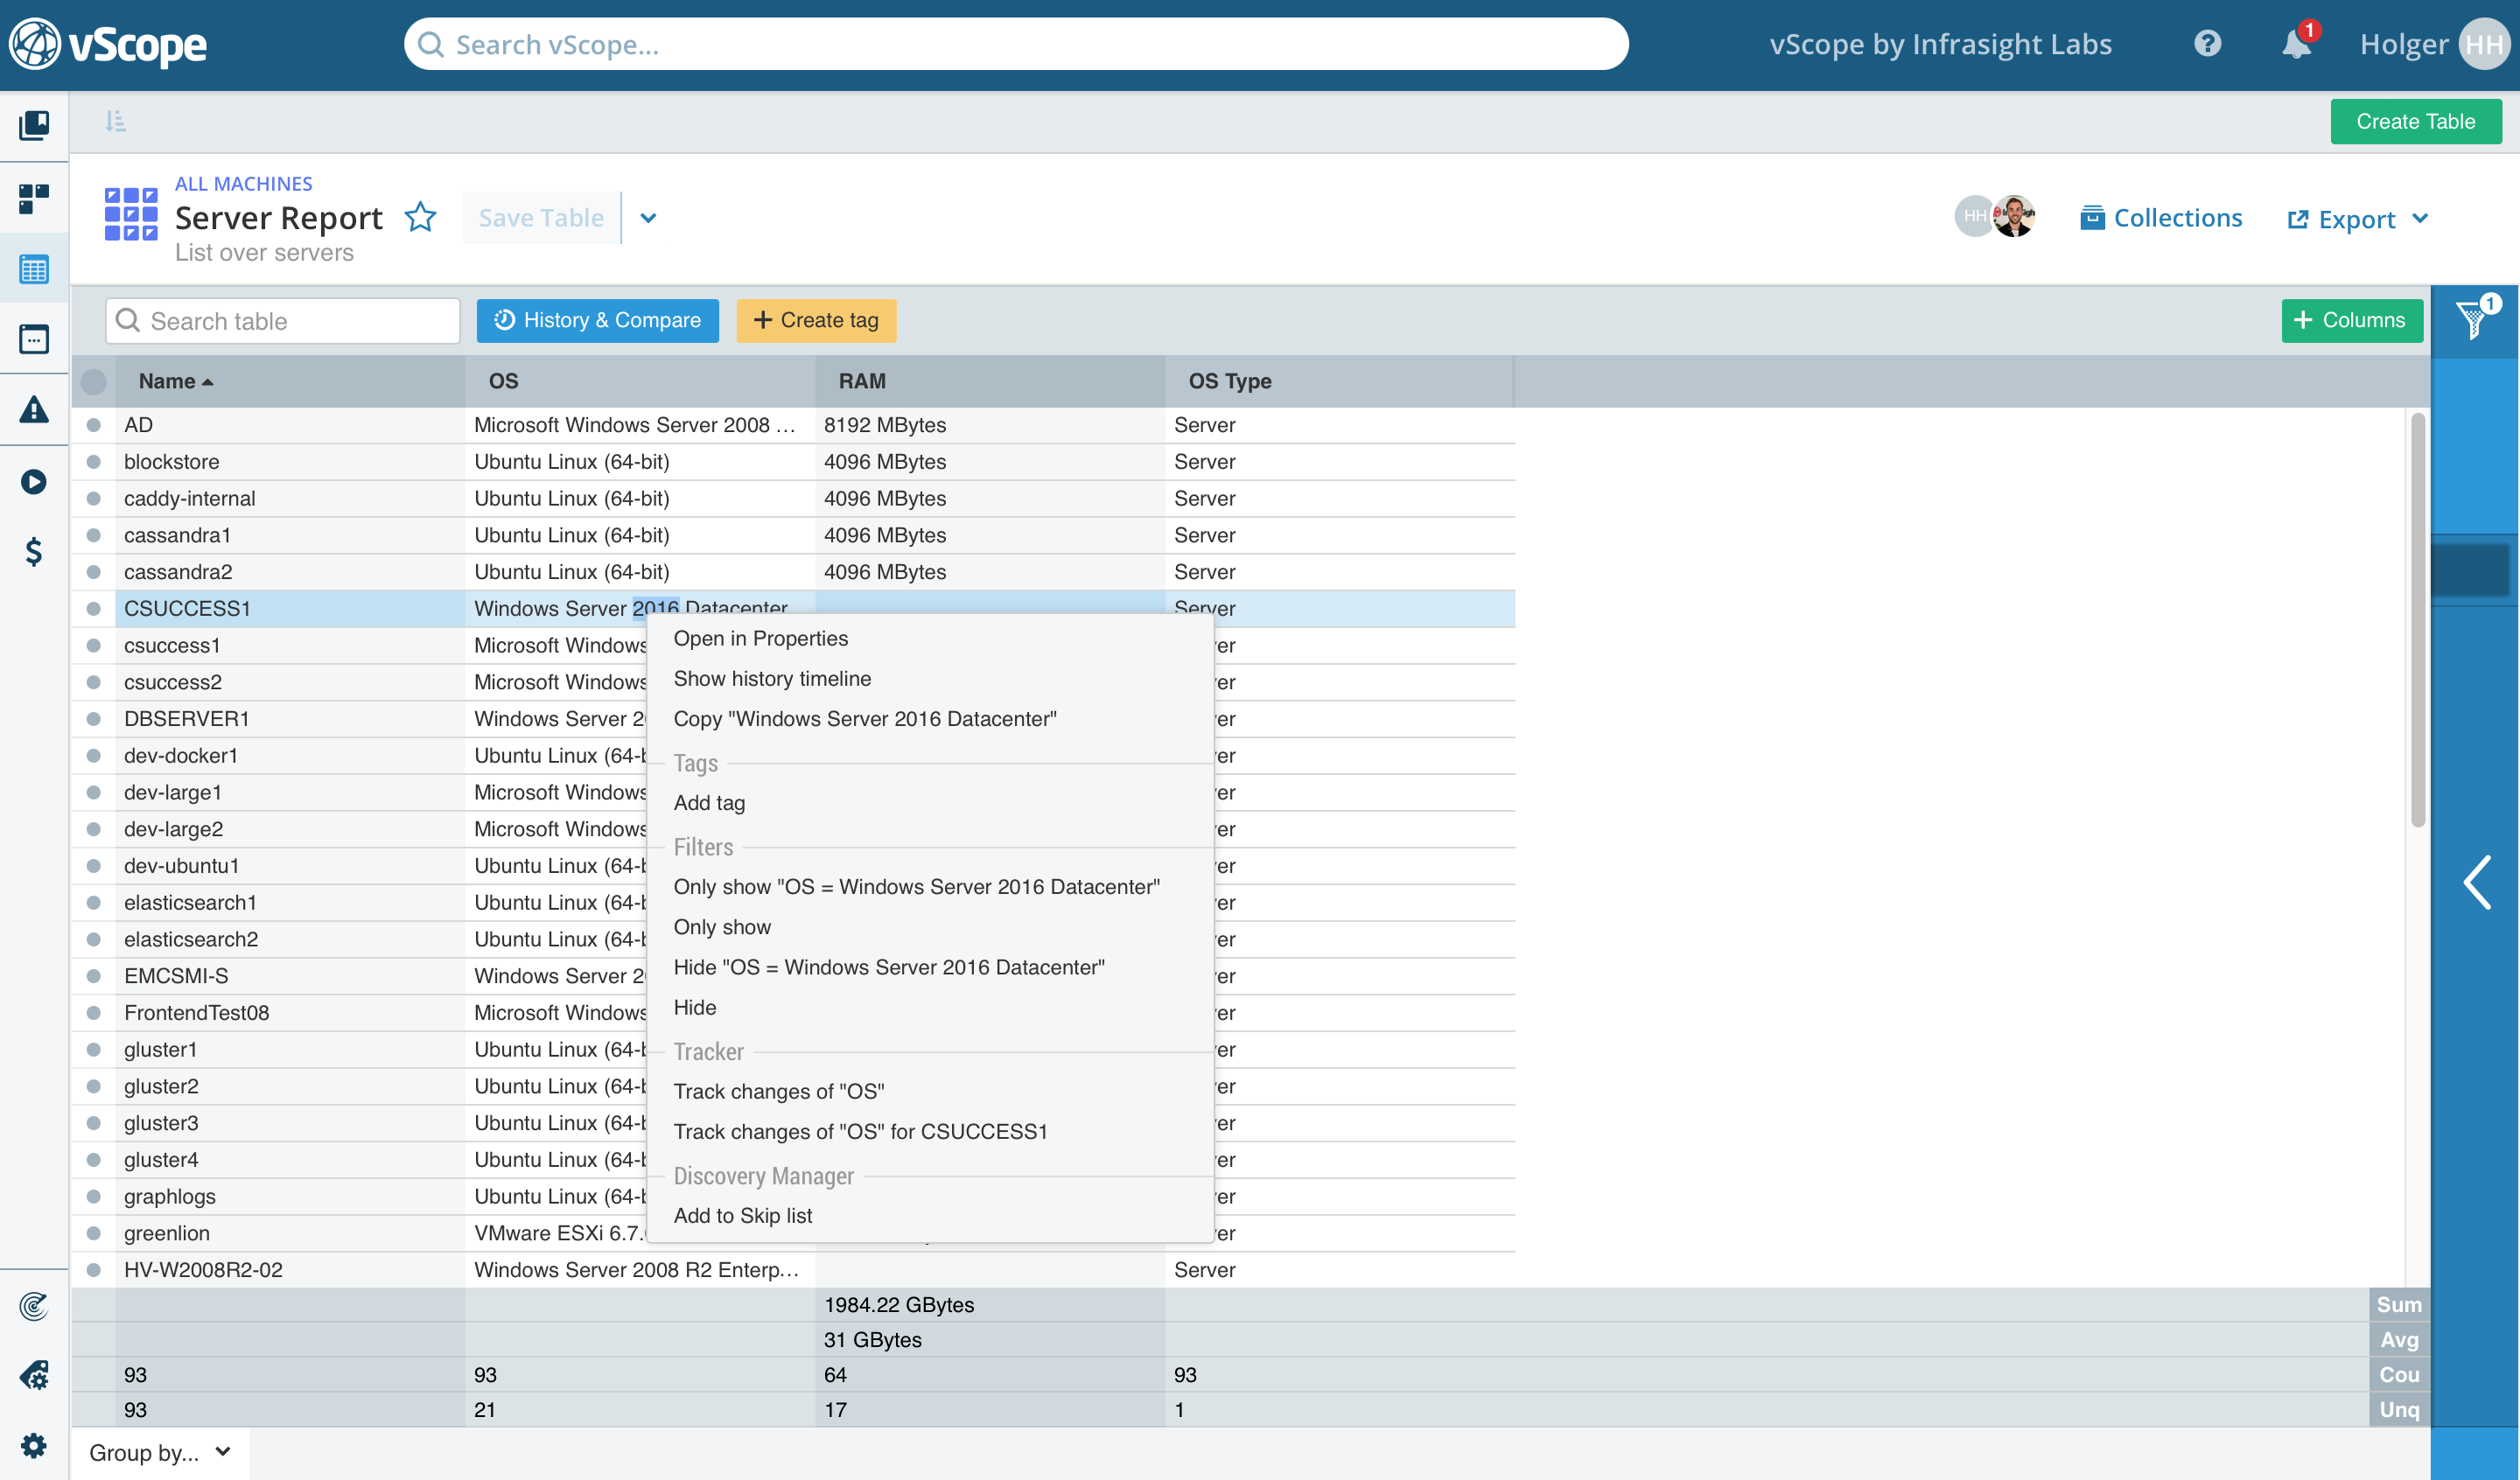
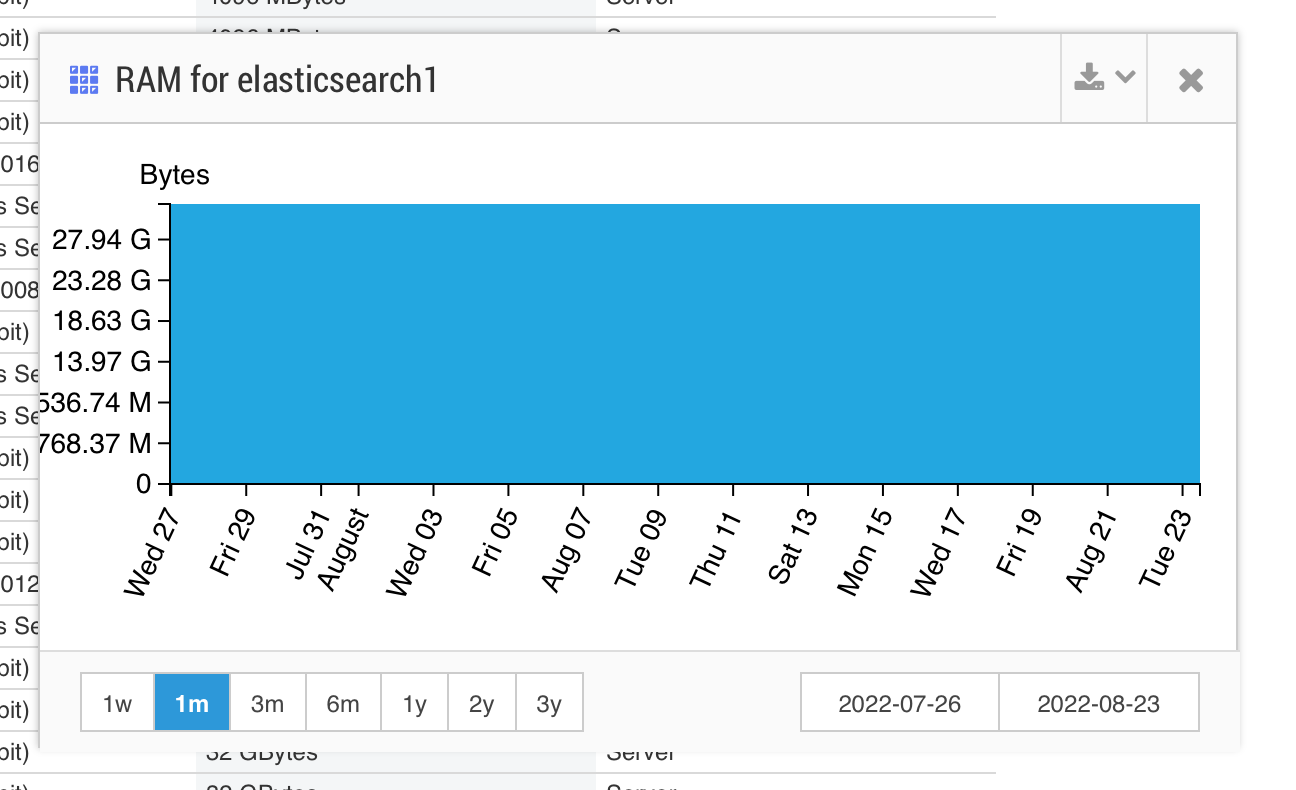
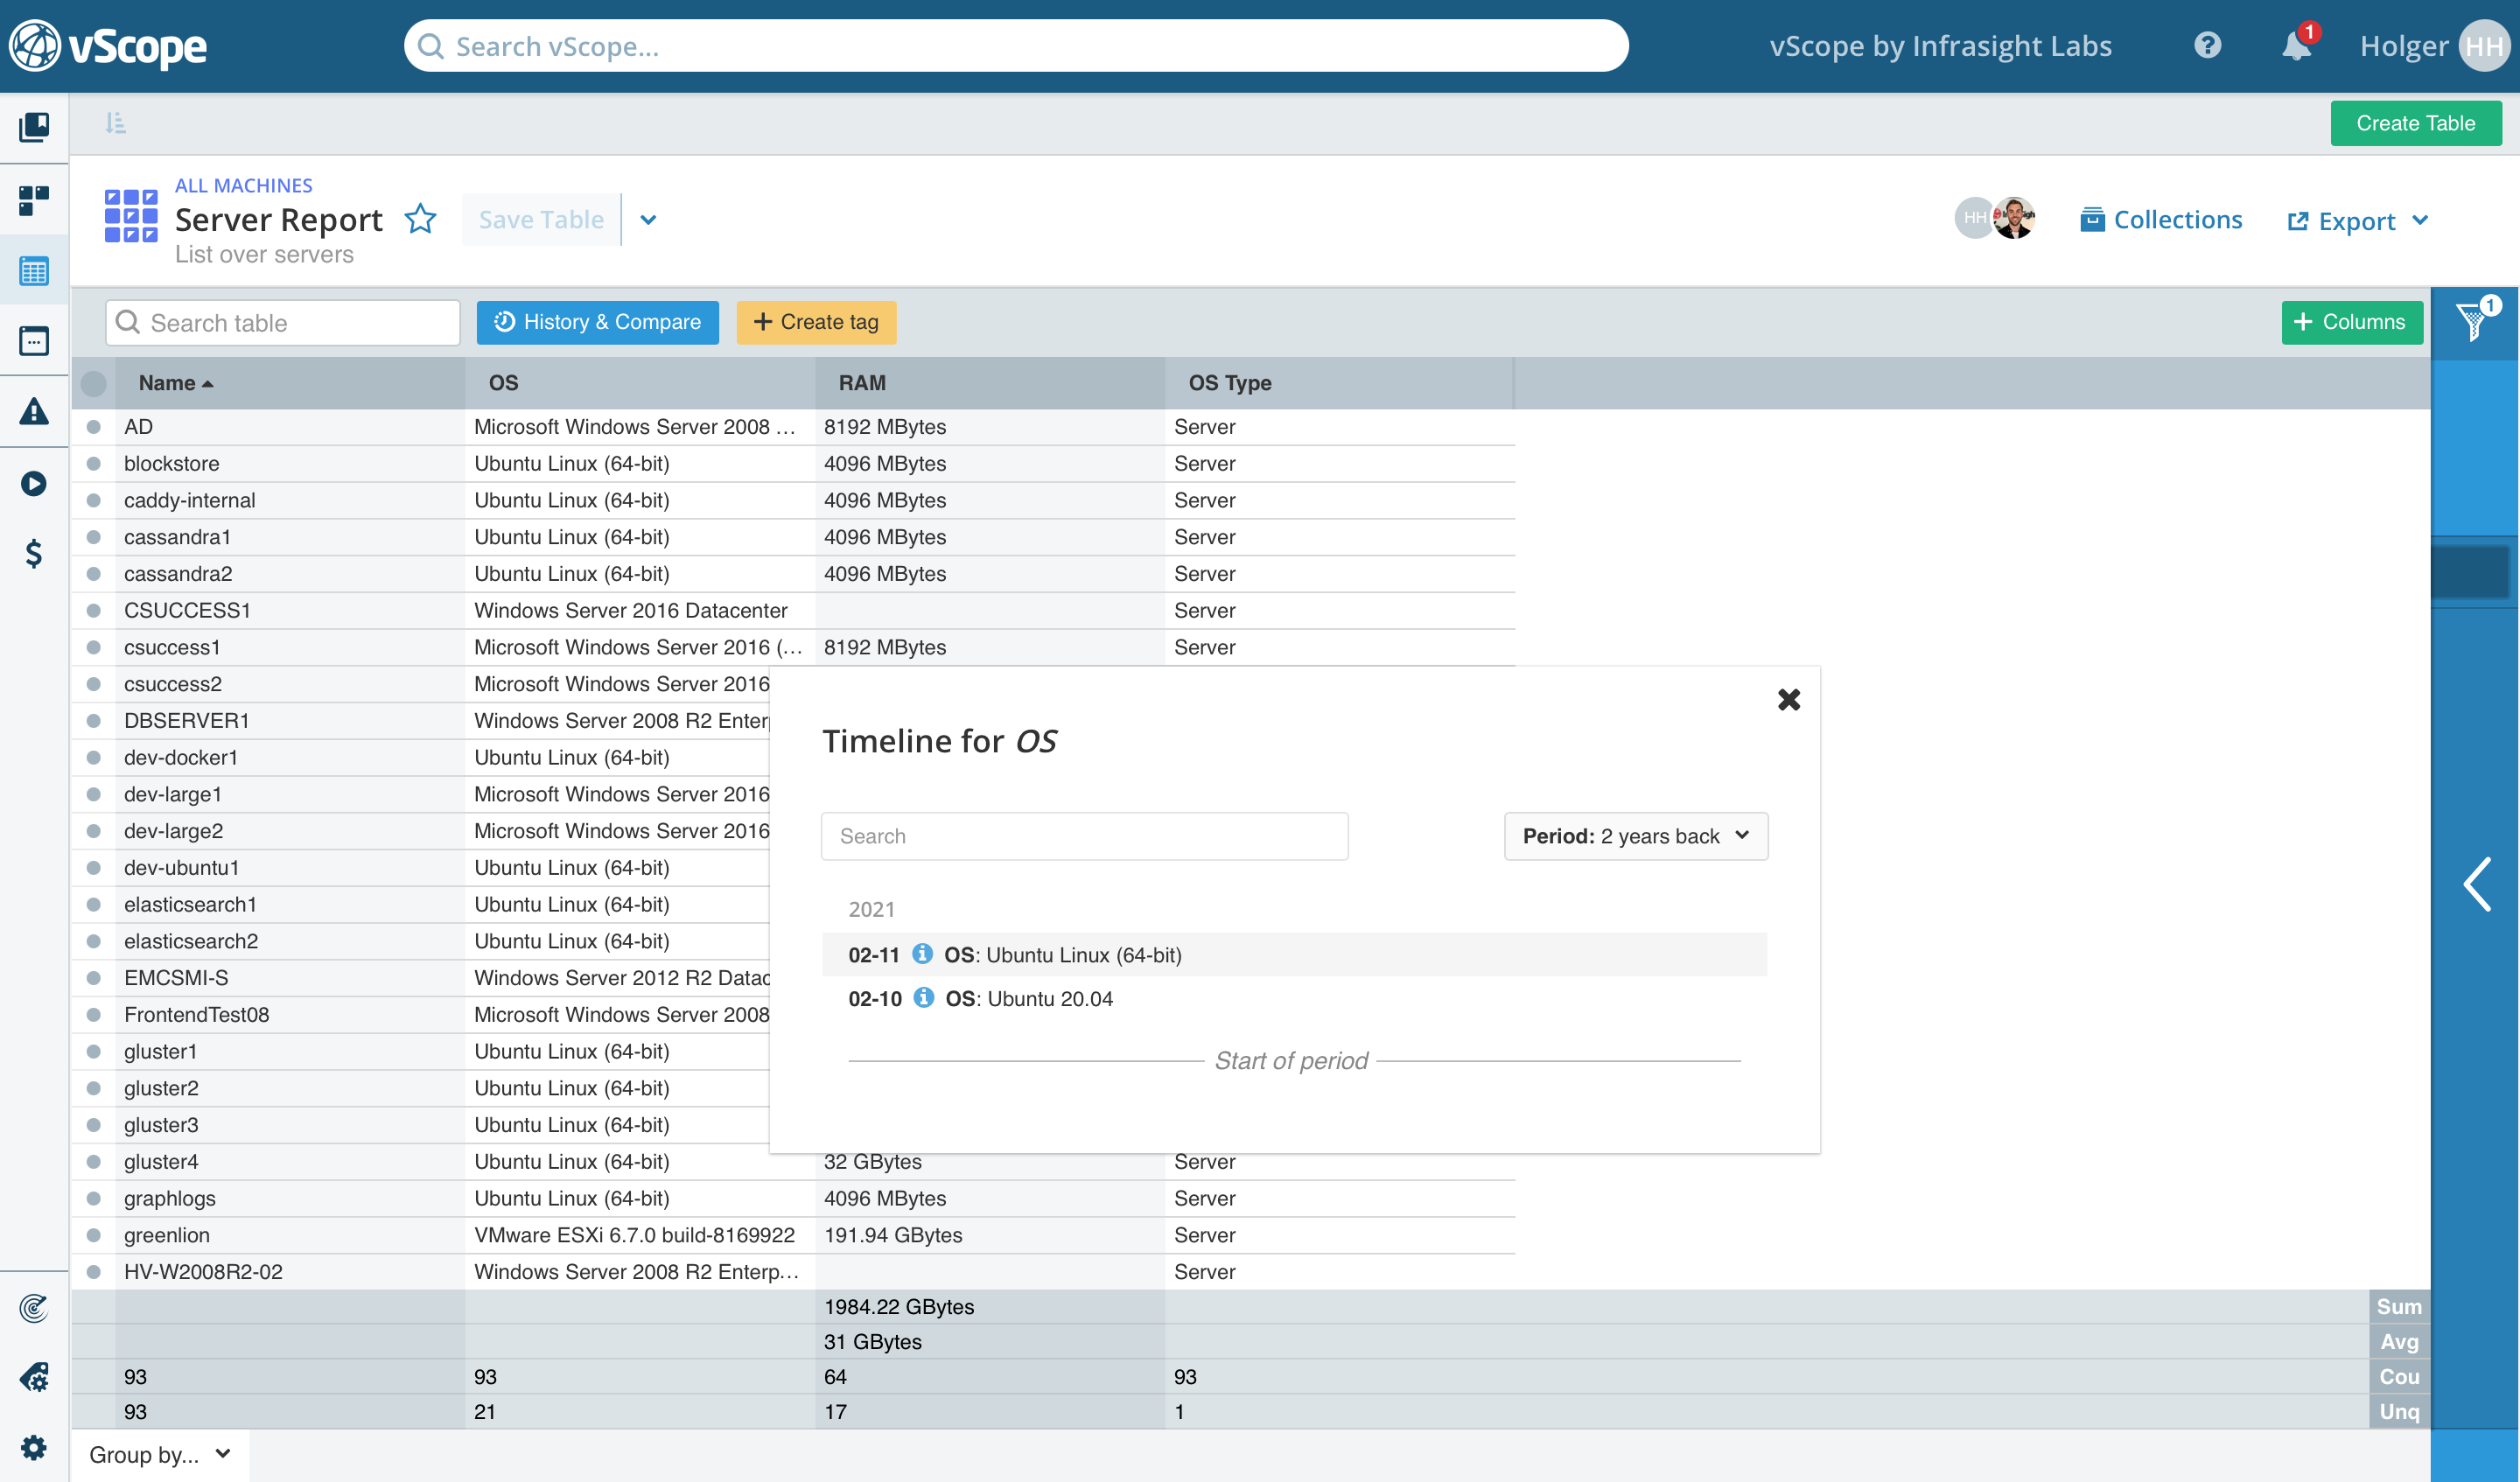
6.1 Historic information
For numeric tags ju simply right klick the value and choose “Plot History Chart”.
For non numeric values you can get the changes in value by clicking “Show History Timeline”.
6.2. Quick filter
Quick filter columns (tags) by right clicking and use the options “Hide” or “Only Show”.
6.3. Track value
Create a Tracker case to get notified whenever any changes are made for a chosen value.